The AI boom has turned computing power into a scarce commodity. Amazon says its cloud is booked solid into 2028, rental prices for advanced graphics processing units (GPUs) are climbing, and companies that locked in capacity early are reportedly reselling it at a premium. Behind the market squeeze sits a physical one: the power lines, transformers, land, cooling water and permits that every new AI data center needs.
This analysis looks at the 2026 compute crunch through a sustainability lens: what is happening to prices and capacity, why electricity is the real bottleneck, what a GPU cluster means in megawatt-hours, tonnes of CO2 and gallons of water, and what buyers should ask before signing. Model your own campus with our free AI Data Center Energy and Water Modeler, or flick through the 11-slide web story.
- What is happening in the GPU market
- Why the bottleneck is power, not chips
- The energy, carbon and water maths of a GPU cluster
- The efficiency paradox
- Stranded compute and embodied carbon
- What AI buyers should ask in 2026
- How cloud AI shows up in your carbon inventory
- Frequently asked questions
What is happening in the GPU market
On 23 October 2026 Amazon CEO Andy Jassy said on an Andreessen Horowitz podcast that Amazon Web Services’ capacity is sold out for 2026, largely sold out for 2027, and that “a good chunk” of 2028 is already committed, Reuters reported. The other hyperscalers have described similar shortages in recent earnings calls.
Rental prices reflect the squeeze. The GetDeploying tracker, which follows nearly 4,000 GPU configurations across 85 cloud providers, shows average rental prices up about 21% over the past 12 months. A September 2026 survey by Mercatus put average on-demand rates at about $3.84 per GPU-hour for an Nvidia H100, $4.43 for an H200 and $6.39 for a B200. Social-media market summaries in late October cited much steeper year-to-date rises, of up to 160% for H200 rentals; we could not verify those figures independently, and prices vary widely between spot, reserved and marketplace deals.
| GPU | Typical rated power | Average on-demand price | Notes |
|---|---|---|---|
| Nvidia A100 80GB | 400 W | — | Older generation still in demand |
| Nvidia H100 SXM | 700 W | ~$3.84 / GPU-hour | Average of 27 providers |
| Nvidia H200 | 700 W | ~$4.43 / GPU-hour | Average of 20 providers |
| Nvidia B200 | up to ~1,000 W | ~$6.39 / GPU-hour | Average of 12 providers |
Prices: Mercatus survey (15 Sep 2026). Power: Nvidia specifications. Trend: GetDeploying, +21% over 12 months (Oct 2026).
Why the bottleneck is power, not chips
Chip supply has improved since 2023; what now limits new capacity is the ability to deliver large blocks of electricity to a site. A single modern AI campus can need hundreds of megawatts, as much as a mid-sized city, and interconnection queues for new grid connections in many US regions run to several years. Land with access to transmission, water for cooling, and air and building permits (including for backup generators, see our data center permitting guide) add further delay.
National projections show the scale. Lawrence Berkeley National Laboratory estimated that US data centers used about 176 TWh in 2023, 4.4% of the nation’s electricity, and could use 325 to 580 TWh by 2028, or 6.7% to 12%. When capacity is sold out years ahead, that demand is effectively already committed.
The energy, carbon and water maths of a GPU cluster
To translate GPUs into environmental terms, we assume about 1.4 kW of average IT load per B200-class GPU, which includes its share of the server, networking and storage and is about 80% of the peak rating of an eight-GPU Nvidia DGX B200 system. We apply a power usage effectiveness (PUE) of 1.3, the US average grid emission factor from EPA eGRID 2023 (771.5 lb CO2e per MWh) and the average on-site water intensity of 0.36 litres per kWh reported by LBNL.
| Cluster size | IT load | Facility load (PUE 1.3) | Energy per year | CO2e (US avg grid) | On-site water |
|---|---|---|---|---|---|
| 1,000 GPUs | 1.4 MW | 1.8 MW | 16 GWh | 5,600 t | 1.5M gal |
| 10,000 GPUs | 14.0 MW | 18.2 MW | 159 GWh | 55,800 t | 15.2M gal |
| 100,000 GPUs | 140.0 MW | 182.0 MW | 1,594 GWh | 557,900 t | 151.6M gal |
Estimates for illustration. Real results depend on utilisation, cooling design, local grid mix and climate. Water excludes the water used to generate the electricity.
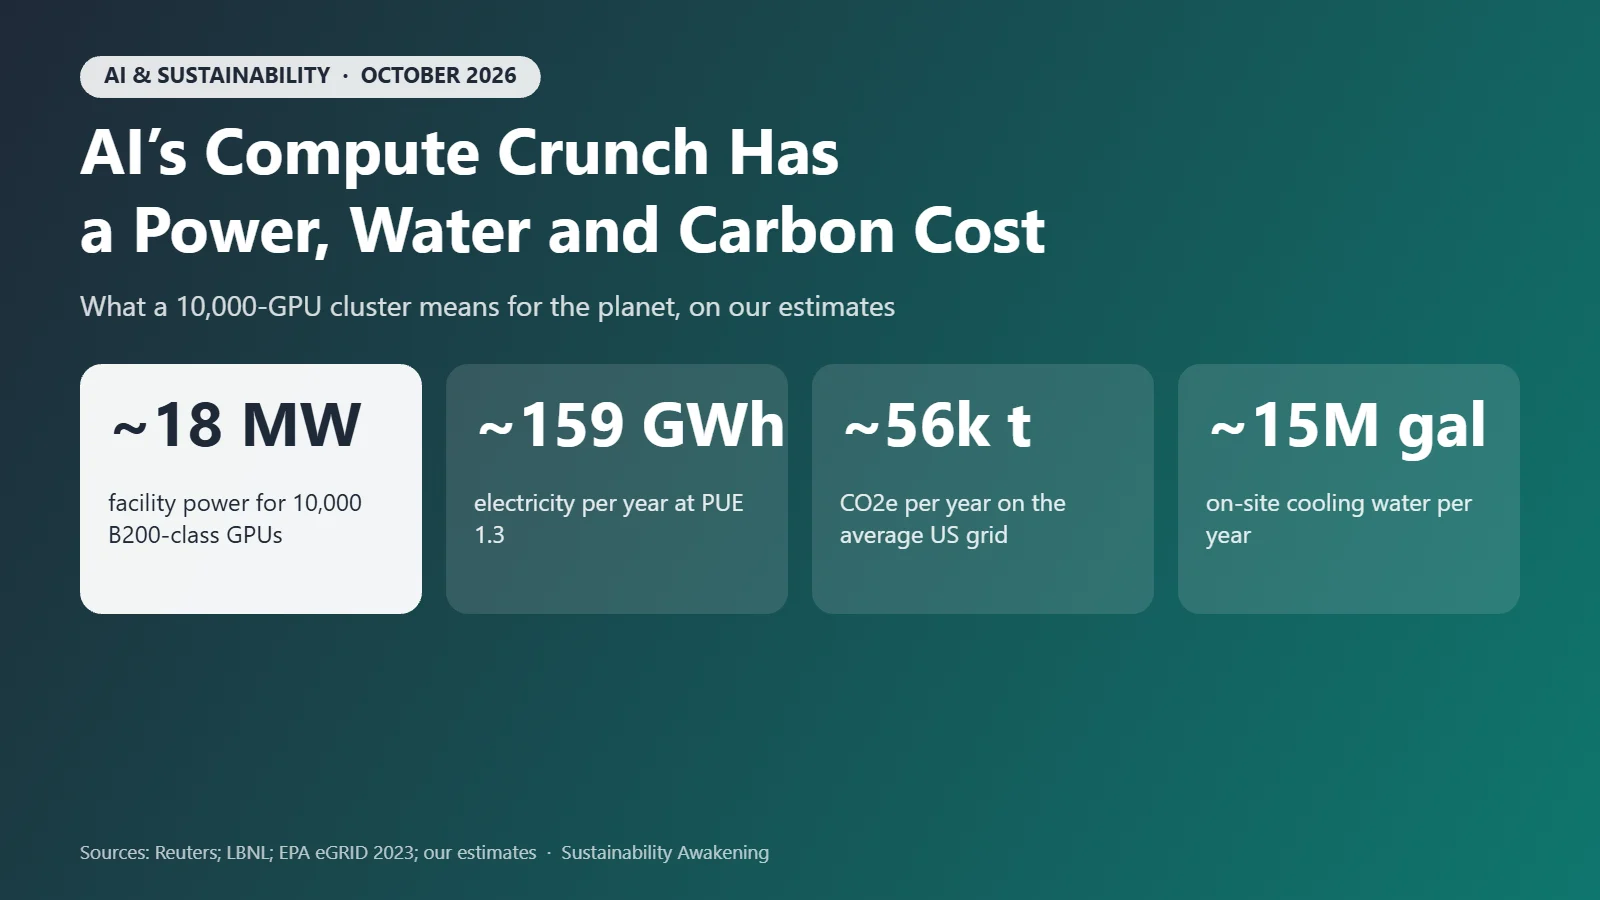
A 10,000-GPU cluster, modest by 2026 frontier standards, would therefore use about 159 GWh a year and emit about 56,000 tonnes of CO2e on the average US grid, comparable to 12,000 typical passenger cars at EPA’s 4.6 tonnes per car per year. It would also evaporate roughly 15 million gallons of water on site if cooled by evaporative towers. A 100,000-GPU campus multiplies each figure by ten.
Location matters as much as size. The same cluster on a coal-heavy grid can emit far more, and in a water-stressed basin its cooling demand competes with homes and farms, as our AI water crisis web story explains. Use the AI Data Center Modeler to compare cooling architectures and grid regions.
A 10,000-GPU cluster at a glance
Our estimate for B200-class GPUs at 1.4 kW each, PUE 1.3, on the average US grid, running all year.
The efficiency paradox
Each GPU generation does far more work per watt than the last, so the energy per AI query or per trained model falls. But scarcity shows that demand is growing faster than efficiency, a classic rebound effect: cheaper computation per task encourages much more computation in total. Efficiency gains reduce the footprint of each task; they do not by themselves cap total energy use.
The most effective levers are therefore about how capacity is used and powered: high utilisation, efficient cooling (see our liquid and immersion cooling guide), scheduling flexible training jobs to hours and regions with cleaner power, on-site storage to shave peaks (our battery storage ROI calculator estimates the economics), and contracts that add new clean generation to the same grid.
Stranded compute and embodied carbon
When buildings are delayed by grid connections, servers bought for them can sit idle or run below capacity. Industry figures have warned that some compute could be stranded in unfinished facilities. Idle hardware still carries its embodied emissions from chip fabrication, packaging, servers and the building itself, and every month it waits is a month of lost useful life. For companies, embodied emissions of purchased hardware fall under Scope 3 Category 2 (capital goods).
Reselling reserved capacity, now reportedly at two to three times the original price, at least keeps hardware working. From a sustainability point of view, a fully used GPU is better than an idle one, whoever pays for it.
What AI buyers should ask in 2026
- Which grid region and data center will run my workload? Ask for the location-based emission factor, not just a renewable-energy certificate claim.
- What are the site’s annual PUE and water usage effectiveness (WUE)? Request measured annual values, not design targets.
- How is the clean-energy claim matched? Annual matching is weaker than hourly (24/7) matching on the same grid.
- Can I get emissions per GPU-hour or per token? Supplier-specific data improves your Scope 3 accuracy.
- What utilisation will my reserved capacity see? Paying for idle capacity wastes money and embodied carbon.
- Can flexible jobs move in time or place? Shifting training to cleaner hours and regions is often the cheapest carbon cut.
How cloud AI shows up in your carbon inventory
For a company renting cloud GPUs, the electricity is the provider’s Scope 2 and the customer’s Scope 3, usually Category 1 (purchased goods and services). Under CSRD and California’s SB 253, larger companies will increasingly be expected to report this with supplier-specific data rather than spend-based estimates. Our enterprise carbon accounting software comparison shows which platforms handle supplier data well, and the free GHG Emissions Engine gives a quick baseline. For a broader overview, see our guide to sustainable data centers and AI energy use.
Frequently asked questions
Why are GPU rental prices rising in 2026?
Demand for AI training and inference is outrunning the supply of powered data center space. Amazon CEO Andy Jassy said on 23 October 2026 that AWS capacity is sold out for 2026, largely sold out for 2027 and that ‘a good chunk’ of 2028 is already booked. The GetDeploying price tracker shows average cloud GPU rental prices up about 21% over the past 12 months across 21 models, with steeper reported rises for scarce newer chips.
How much electricity does an AI GPU use?
An Nvidia H100 SXM is rated at up to 700 watts and a B200 at up to about 1,000 watts. Including its share of the server, networking and storage, each GPU in a large cluster draws roughly 1.4 kilowatts of IT load on average, and more once cooling and power conversion are added through the facility’s power usage effectiveness (PUE).
How much carbon does a 10,000-GPU AI cluster emit?
On our assumptions (1.4 kW per GPU, PUE 1.3, the 2023 US average grid factor of 771.5 lb CO2e per MWh), a 10,000-GPU B200-class cluster running all year uses about 159 GWh and emits about 56,000 tonnes of CO2e, roughly as much as 12,000 typical US passenger cars. Contracting 24/7 clean power cuts the location-based figure only if the clean supply is added on the same grid.
Do AI data centers use a lot of water?
Many do, mainly through evaporative cooling. At the US average of about 0.36 litres per kWh measured by Lawrence Berkeley National Laboratory, our 10,000-GPU example would consume about 15 million gallons a year on site, before counting the water used by power plants. Closed-loop liquid cooling can cut on-site water use sharply.
Is using cloud GPUs part of my company’s Scope 3 emissions?
Yes. For a cloud customer, purchased compute is generally reported under Scope 3 Category 1 (purchased goods and services) using supplier-specific data where available. The cloud provider reports the same electricity as its own Scope 2. Ask providers for region-level, location-based and market-based emissions per unit of compute.
Sources
- Reuters, Amazon cloud capacity sold out through 2027, CEO Jassy says (23 Oct 2026)
- GetDeploying, cloud GPU rental prices and 12-month trend (accessed 25 Oct 2026)
- Mercatus, GPU rental prices: H100, H200, B200 cost per hour (15 Sep 2026)
- Lawrence Berkeley National Laboratory, 2024 United States Data Center Energy Usage Report
- US EPA, eGRID 2023 summary data
- US EPA, Greenhouse gas emissions from a typical passenger vehicle
- Nvidia product specifications for H100, H200, B200 and DGX B200 systems.
Cluster figures are illustrative estimates, not measurements of any specific facility. Market prices change quickly; this is not investment advice.
Water Footprint Impact Calculator
Measure direct and virtual water consumption across household, agricultural, and industrial supply chains against regional watershed stress metrics.
Calculate Water Footprint →