Corporate power purchase agreements are no longer just a sustainability purchase; they are a treasury decision. With electricity demand from data centres climbing, solar tariffs pushing prices up and the rules for counting clean power under review, a 10- to 20-year PPA can either hedge your power bill or lock in a loss.
This guide explains how virtual, physical and on-site deals work, what developers are charging in 2026, what new renewables cost to build, the risks that decide whether a deal pays, and how Scope 2 accounting is changing. To test a deal against your own load and prices, use our free Corporate PPA ROI & LCOE Modeler. For the short version, see the corporate PPA web story.
Corporate PPAs at a glance
The numbers behind a 2026 procurement decision.
- Why corporate PPAs matter in 2026
- Virtual, physical and on-site: the three structures
- PPA prices in 2026: what developers are offering
- What new renewables cost to build (LCOE)
- How a virtual PPA hedge works: a worked example
- The risks that decide whether a PPA pays
- Scope 2 accounting and the GHG Protocol revision
- Policy: tax credits, tariffs and permitting
- A buyer’s playbook by company type
- Frequently asked questions
Why corporate PPAs matter in 2026
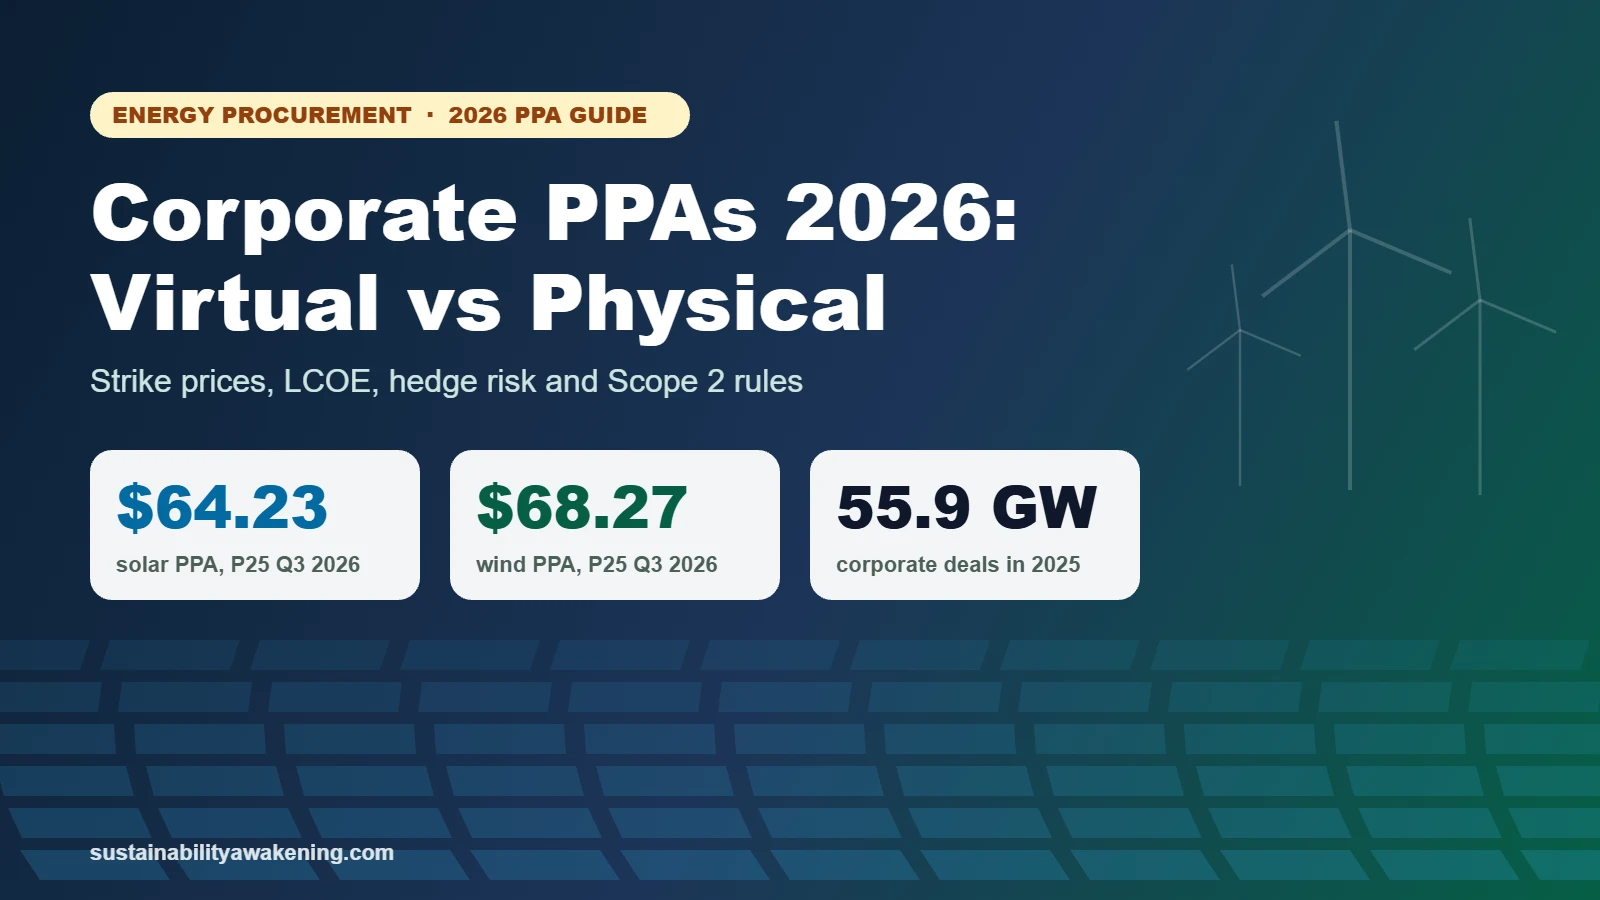
Corporate clean energy buying fell for the first time in nearly a decade in 2025. BloombergNEF counted 55.9 GW of deals, 10% below the 2024 record (BloombergNEF, Feb 2026). The market split in two:
- Big Tech dominated. Meta, Amazon, Google and Microsoft signed 49% of all deals. Meta and Amazon alone contracted 20.4 GW, including 4.7 GW of nuclear.
- The US hit a record, with fewer buyers. US deals reached 29.5 GW, but the number of unique corporate buyers fell 51% to just 33.
- Europe cooled. EMEA volumes slid 13% to 17 GW, as more hours of negative power prices eroded the value of stand-alone solar and wind deals.
In other words, the hyperscalers powering AI kept buying, while many mid-sized companies paused. LevelTen reports that ongoing revisions to the GHG Protocol have led many corporates to wait for certainty (LevelTen, Oct 2026). That pause has a cost: tax-credit deadlines and tariffs are moving prices now. For data centre operators, see also our AI data centre energy and water modeler.
Virtual, physical and on-site: the three structures
| Virtual PPA (VPPA) | Physical PPA | On-site solar | |
|---|---|---|---|
| What you buy | A financial contract for difference plus RECs | Delivered power plus RECs | Power from panels on your site |
| How you pay | Settle (market − strike) × MWh in cash | Strike plus sleeving and shaping fees | Capex or a lease or on-site PPA |
| Your utility bill | Unchanged | Energy part replaced | Reduced, including some delivery charges |
| Location | Any liquid market | Same market as your load | Your roof, car park or land |
| Typical size | Large (often 50 MW+) | Medium to large | Small (10–30% of site load) |
| Main risk | Market price, basis and shape | Volume and sleeving costs | Upfront cost and site limits |
| Accounting | Often a derivative | Often an executory contract; check lease and derivative rules | Asset or lease |
Simplified. Contract terms vary; take legal and accounting advice.
A virtual PPA leaves your utility arrangements unchanged. You and the developer agree a strike price; the project sells its power into the wholesale market, and you settle the difference in cash. When market prices are high, you receive money that offsets your higher utility bill; when they are low, you pay. That is why a VPPA works as a long-term hedge on power prices rather than a direct saving.
A physical PPA delivers the power to you, usually through your utility or retail supplier, which charges a fee to “sleeve” the project’s variable output into the steady supply you need. It replaces part of your energy purchase directly.
On-site solar, sometimes paired with batteries, avoids both energy and some delivery charges, but space limits it to a fraction of most sites’ load. Our battery storage ROI calculator shows when adding storage pays.
PPA prices in 2026: what developers are offering
LevelTen Energy publishes the most widely used index of PPA offers in North America, based on developer offers on its marketplace. Its Q3 2026 report introduced new “Core-Markets” prices (LevelTen):
| Technology | Core-markets P25 price | Quarterly change (Continental Index) | Main driver |
|---|---|---|---|
| Solar | $64.23/MWh | +4.9% | Section 232 tariffs on the whole solar supply chain |
| Wind | $68.27/MWh | −0.1% | Stalled federal permits; ERCOT offers pulled the index down |
P25 = 25th percentile of developer offers. Source: LevelTen Energy, Q3 2026 PPA Price Index.
Two pressures dominate. On solar, Section 232 tariffs announced in early August combine a 15% blanket tariff with a minimum import price on polysilicon, ingots, wafers, cells and modules. LevelTen cites analysis showing imported module prices rising by more than 40%, even though the tariffs only take effect in December. On wind, many US projects are stuck because federal aviation and defence agencies have not been issuing the “no hazard” determinations projects need, so some buyers are turning to operating wind farms.
What new renewables cost to build (LCOE)
The levelised cost of energy (LCOE) is the average cost per MWh of building and running a plant over its life. It sets a floor under PPA prices. Lazard’s 2026 report, which excludes subsidies, shows renewables getting more expensive after years of decline (pv magazine, Jul 2026):
| Technology | 2026 range | Note |
|---|---|---|
| Utility-scale solar | $40–98 | Up 18% from $38–78 in 2025 |
| Onshore wind | $37–99 | Most cost-competitive renewable |
| Utility solar + storage | $61–156 | Adds dispatchability |
| Onshore wind + storage | $49–140 | |
| Community and C&I solar | $88–197 | Relevant for on-site projects |
| Offshore wind | $105–167 | Higher construction and financing costs |
Source: Lazard Levelized Cost of Energy+ 2026, as reported by pv magazine. Excludes transmission, land and permitting costs.
Lazard attributes the rise in solar costs to higher capital costs, interest rates, tariffs and supply chain pressures. It still describes utility-scale solar as one of the lowest-cost sources of new power, with costs about 81% lower than in its first edition two decades ago.
How a virtual PPA hedge works: a worked example
Take an industrial manufacturer using 300,000 MWh a year that wants to cover 60%, or 180,000 MWh, with solar. These are the modeler’s illustrative inputs: a $64.23 strike, a $55 hub price, a 0.85 solar capture factor, a $6 sleeving fee, a $72 energy supply price and prices rising 2% a year.
| Physical PPA | Virtual PPA | |
|---|---|---|
| Year-one impact | +$318,600 | −$3.15M |
| 12-year total, base case | +$22.1M | −$25.9M |
| If prices fall 1%/yr | −$4.5M | −$43.1M |
| If prices rise 5%/yr | +$54.6M | −$4.8M |
| Break-even | $70.2/MWh supply price | $75.6/MWh hub price |
| Scope 2 avoided | 63,000 t a year | 63,000 t a year |
Illustrative, undiscounted, from our PPA modeler. Real results depend on your market, tariff and contract.
The physical PPA wins here because the buyer pays $70.23 all-in instead of a $72 supply price. The virtual PPA loses money because a solar farm in this example only earns about $47 per MWh in the market (85% of the $55 hub price) against a $64.23 strike. The VPPA only breaks even if hub prices reach about $75.60.
That does not make the VPPA a bad deal. Its job is to hedge: if prices spike, settlement payments rise to offset a higher utility bill. But it shows why buyers must stress-test hub prices and capture factors before signing. Run your own numbers in the PPA modeler.
The risks that decide whether a PPA pays
- Price risk: in a VPPA you lose when market prices stay below the strike. Model a range of forward curves, not one.
- Shape or capture risk: solar produces at midday, when prices are often lowest. Its capture price can be well below the average hub price, and the gap grows as more solar is built.
- Negative prices and curtailment: BloombergNEF notes rapidly increasing hours of negative prices in Europe. Check who pays when prices go negative and whether output is curtailed.
- Basis risk: the project is paid at its own node but settles against a hub. Congestion can open a gap between the two.
- Volume risk: physical PPAs that pay for “as-generated” output leave the buyer to balance a variable supply, which the sleeving fee only partly covers.
- Credit and term: 10- to 20-year commitments need credit support and may outlast business plans. Consider shorter terms or portfolio deals.
- Accounting: a VPPA can be a derivative under US GAAP (ASC 815) or IFRS 9, bringing fair-value volatility into earnings unless hedge accounting applies.
Scope 2 accounting and the GHG Protocol revision
Under the GHG Protocol’s 2015 Scope 2 Guidance, companies report Scope 2 two ways. The location-based figure uses average grid emission factors and does not change with a PPA. The market-based figure reflects contractual instruments, so retiring the renewable energy certificates (RECs) from a PPA reduces it.
Those rules are under review. The GHG Protocol’s public consultation ran from October 2025 to January 2026. In July 2026 its Independent Standards Board indicated majority support for developing two market-based methods (GHG Protocol, Oct 2026):
- Method 1 would add hourly matching, deliverability and incrementality requirements, so certificates count only if matched to consumption hour by hour and generated in a grid region that can deliver to you.
- Method 2 would keep the existing 2015 market-based requirements.
The Science Based Targets initiative moved separately. LevelTen reports that SBTi’s final V2.0 guidance, published in June 2026, did not mandate hourly matching but pushes buyers to procure RECs from within their “deliverability regions”. Contracts signed before 1 February 2027 are covered by a legacy provision. For buyers with science-based targets, that creates a short window. See our SBTi net zero guide, and baseline your Scope 2 in the GHG Emissions Engine.
Practical takeaway: favour projects in the same grid region as your load, ask for hourly generation data in the contract, and keep location-based and market-based figures side by side in your reporting.
Policy: tax credits, tariffs and permitting
US policy is pulling in two directions. The July 2025 tax law known as the One Big Beautiful Bill Act phases out the clean electricity tax credits for wind and solar: projects that begin construction after 4 July 2026 must be placed in service by the end of 2027 to qualify (Sidley Austin). LevelTen notes that safe-harbored projects must be in service by the end of 2030, and that because PPAs often underpin project finance, developers need buyers soon to deliver that pipeline at today’s economics.
At the same time, the Section 232 tariffs raise solar costs and stalled permits slow wind. The result is a market where today’s offers may be the cheapest buyers will see for some time, but where uncertainty over accounting rules is keeping many buyers on the sidelines.
A buyer’s playbook by company type
| Buyer type | Typical load | Usual structure | Priority |
|---|---|---|---|
| Tech hyperscaler | 1–2+ TWh a year | Large VPPAs, plus nuclear, hydro and geothermal deals | 24/7 carbon-free supply near data centres |
| Industrial manufacturer | 100,000–500,000 MWh | Physical or virtual PPA for 30–70% of load | Long-term price certainty |
| Mid-market retail | 10,000–50,000 MWh | On-site solar, aggregated VPPAs or green tariffs | Bill savings and simple contracts |
Presets for each buyer type are built into our PPA modeler.
- Baseline your load by site, grid region and hour.
- Set the goal: cost hedge, Scope 2 reduction, hourly matching, or all three.
- Choose a structure that fits your markets and your appetite for accounting volatility.
- Stress-test strike, hub price, capture factor and term in the modeler.
- Run a competitive process through a marketplace or adviser, and negotiate negative-price, curtailment and credit terms.
- Lock in REC retirement and reporting data before signing.
Clean power also helps other obligations. New York building owners facing Local Law 97 penalties, for example, can count qualifying renewable energy certificates against grid electricity emissions; see our Local Law 97 guide. Unlike carbon credits, PPAs cut your own reported Scope 2 emissions; see our carbon credit prices guide for how the two fit together.
Frequently asked questions
What is a virtual PPA?
A virtual power purchase agreement (VPPA) is a financial contract for difference. The buyer agrees a fixed strike price with a renewable project. The project sells its power into the wholesale market; if the market price is above the strike, the developer pays the buyer the difference, and if it is below, the buyer pays the developer. The buyer keeps buying electricity from its utility as normal and usually receives the project’s renewable energy certificates.
What is the difference between a virtual and a physical PPA?
In a physical PPA the buyer actually takes the electricity, usually delivered or ‘sleeved’ through a utility or retailer, and pays the PPA price instead of its normal energy supply price. In a virtual PPA no power changes hands; the contract is settled in cash against a wholesale market price. Physical PPAs need the buyer and project to be in the same market and often involve sleeving fees; virtual PPAs can be signed with projects anywhere in a liquid market.
What are PPA prices in 2026?
LevelTen Energy’s Q3 2026 index put its core-markets P25 solar price at $64.23 per MWh and wind at $68.27 per MWh in North America. P25 means the 25th percentile of developer offers, so a quarter of offers were cheaper. Solar prices rose 4.9% in the quarter, driven largely by new Section 232 tariffs on solar components.
Does a PPA reduce Scope 2 emissions?
Under the GHG Protocol’s market-based method, a company can report lower Scope 2 emissions if it retains and retires the renewable energy certificates from its PPA. Location-based Scope 2, which uses average grid emission factors, does not change. The GHG Protocol is revising these rules and is considering a stricter method with hourly matching and deliverability requirements alongside the current approach.
How is a virtual PPA accounted for?
Because a virtual PPA is settled in cash against a market price, it can meet the definition of a derivative under US GAAP (ASC 815) or IFRS 9, which may require fair-value accounting with gains and losses in earnings unless hedge accounting or an exception applies. The treatment depends on contract terms, so buyers should involve their auditors before signing.
How much do on-site solar panels cost per MWh for a business?
Lazard’s 2026 analysis puts the unsubsidised levelised cost of community and commercial and industrial solar at roughly $88 to $197 per MWh, compared with $40 to $98 for utility-scale solar. On-site solar can still save money because it avoids delivery charges as well as energy charges, but it usually covers only 10% to 30% of a site’s load.
Sources
- LevelTen Energy, North American PPA Price Index, Q3 2026 (20 Oct 2026)
- BloombergNEF, Corporate clean energy buying fell in 2025 (19 Feb 2026)
- pv magazine USA, U.S. solar LCOE on the rise, says Lazard (13 Jul 2026)
- Lazard, Levelized Cost of Energy+ (LCOE+)
- GHG Protocol, Scope 2 market-based method update (16 Oct 2026)
- Sidley Austin, The One Big Beautiful Bill Act: navigating the new energy landscape (Jul 2025)
This guide is for general information and is not financial, legal or accounting advice. Take professional advice before signing a PPA.
Water Footprint Impact Calculator
Measure direct and virtual water consumption across household, agricultural, and industrial supply chains against regional watershed stress metrics.
Calculate Water Footprint →