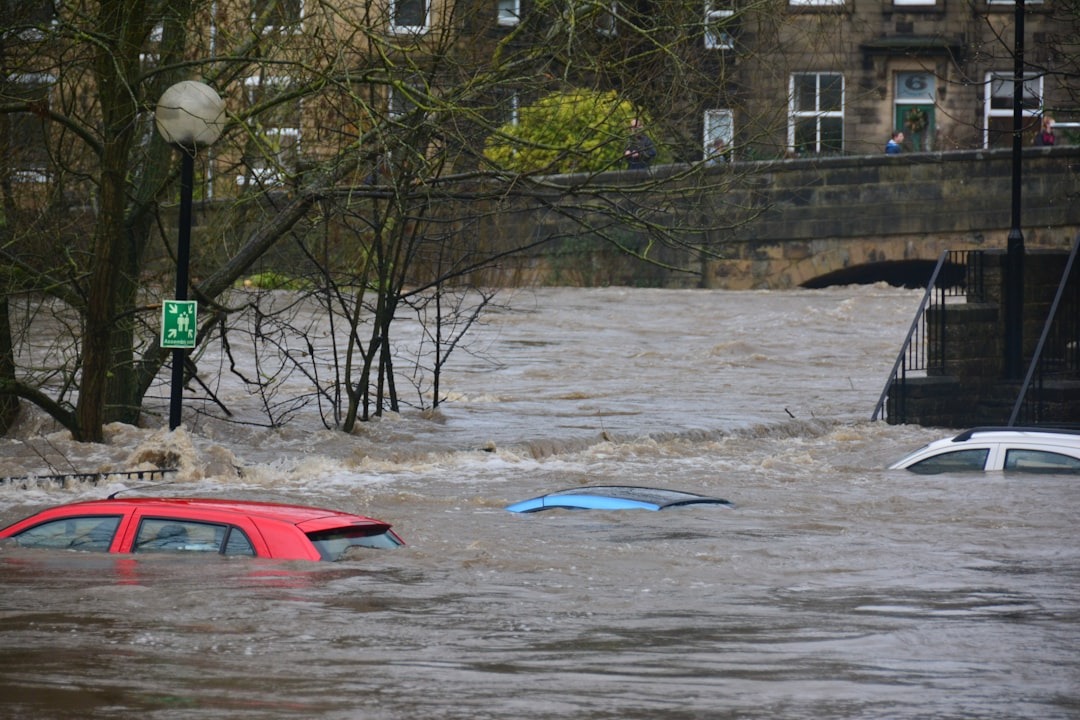
More than three decades since the Rio Earth Summit launched global climate diplomacy, and more than eight years since the Paris Agreement was heralded as a historic breakthrough, the world’s response to the climate crisis remains profoundly inadequate. Despite landmark pledges, proliferating net-zero commitments, and record renewable energy deployment, global greenhouse gas emissions reached a new all-time high in 2023. The gap between political ambition and physical reality has never been more alarming — or more consequential.
The Data on Global Failure: By the Numbers
The scientific record is unambiguous. Global greenhouse gas emissions in 2023 reached approximately 57.1 billion tonnes of CO₂-equivalent (GtCO₂e), according to the UN Environment Programme’s Emissions Gap Report 2024 — a new record, surpassing the previous peak set in 2019. This comes despite the Paris Agreement’s 2015 commitment to limit global warming to well below 2°C, preferably 1.5°C, above pre-industrial levels.
To have a reasonable chance (66%) of limiting warming to 1.5°C, global emissions need to fall approximately 43% from 2019 levels by 2030 — just six years away. Instead, they have increased. Even achieving the less ambitious 2°C target requires a 27% reduction from 2019 levels by 2030. Current policies, if fully implemented, put the world on track for 2.8°C to 3.1°C of warming by 2100 — a level of heating that climate scientists describe as potentially catastrophic and incompatible with organized, stable human civilization as we know it.
The World Meteorological Organization confirmed that 2023 was the hottest year on record by a significant margin, with the global average temperature approximately 1.45°C above pre-industrial levels — uncomfortably close to the 1.5°C threshold that the Paris Agreement designated as the aspirational ceiling. The first breach of 1.5°C as a 20-year running average is now projected between 2030 and 2035 under current trajectories.
Where Emissions Are Coming From: The Biggest Emitters
Understanding the geography of global emissions is essential for diagnosing why collective action has failed. The top five emitters — China, the United States, India, the European Union, and Russia — together account for approximately 60% of global greenhouse gas emissions. Their choices and policies dominate the global trajectory:
- China (31% of global CO₂): Despite being the world’s largest installer of renewable energy, China is also building new coal power plants at a pace that dwarfs global additions elsewhere. In 2023, China permitted 100+ GW of new coal capacity. China’s per-capita emissions now exceed the EU average, and its cumulative emissions since 2000 are the largest of any nation.
- United States (14% of global CO₂): The US has reduced absolute emissions by roughly 17% from 2005 levels, largely through the coal-to-gas switch in electricity generation. The Inflation Reduction Act (2022) represented the largest climate investment in US history at ~$369 billion — but critics argue implementation has been slower than needed and may be vulnerable to policy reversals.
- India (7% of global CO₂): Emissions are growing rapidly as India industrializes and its population of 1.4 billion increases energy consumption. India’s per-capita emissions remain a fraction of US or EU levels, creating a fundamental equity dimension to the global conversation.
- EU (8% of global CO₂): The EU has the strongest absolute emissions trajectory, having reduced emissions approximately 33% below 1990 levels by 2023. But the EU’s global share of emissions is declining even as its ambitions intensify, raising questions about the global leverage of European climate leadership.
- Russia: Despite climate pledges, Russia’s economy remains deeply dependent on fossil fuel exports, and Gazprom and Rosneft remain among the world’s largest contributors to methane leakage — a potent short-term warming agent.
The NDC Implementation Gap: Promises vs. Policies
Under the Paris Agreement, countries submit Nationally Determined Contributions (NDCs) — climate action pledges — that are updated every five years. The UN’s NDC Synthesis Report (2023) found that even if all current NDCs were fully implemented — an assumption that drastically overstates real-world performance — the world would still emit approximately 20-24 GtCO₂e more per year than the 1.5°C pathway requires by 2030. This is the “emissions gap” — arguably the defining measure of collective climate failure.
Making matters worse, analysis of actual policy implementation consistently shows that countries fall short of even their own pledges. Climate Action Tracker, an independent science-based analysis system, assessed in 2024 that no major emitting country has policies sufficient to meet its own NDC targets. Australia, Canada, and the United States were rated “Insufficient.” China’s pledge — to reach peak emissions before 2030 and carbon neutrality before 2060 — is rated “Highly Insufficient” by CAT given the current trajectory of coal expansion.
Net-Zero Pledges: A Credibility Crisis
One of the most significant developments since Paris has been the proliferation of net-zero pledges. By 2024, countries and territories representing approximately 90% of global GDP and 88% of global emissions had adopted some form of net-zero target. Yet the quality, credibility, and legal bindingness of these pledges vary enormously.
A 2023 analysis by the Oxford Net Zero initiative found that of 4,000 net-zero pledges by governments, cities, regions, and companies, fewer than 20% met minimum credibility standards for interim targets, existing emissions reductions, and plans to address supply chain emissions. Many pledges rely heavily on carbon offsets — particularly forests — that independent analysis has found to be substantially less effective than claimed. A 2023 investigation by The Guardian, Zeit Online, and Source Material found that more than 90% of Verra’s rainforest offset credits — the world’s largest carbon standard — were “phantom credits” that did not represent real carbon reductions.
The Finance Gap: Money Is There, But Not Where It Needs to Be
Global investment in clean energy reached a record $1.77 trillion in 2023, according to BloombergNEF — roughly matching fossil fuel investment for the first time in history. Yet this aggregate figure conceals a profound geographic inequality that is central to the failure of global climate action. Approximately 75% of clean energy investment occurs in China, the US, and Europe — the world’s three largest economies. The remaining 140+ developing countries, home to 6 billion people and containing the world’s fastest-growing economies, receive just 25% of global clean energy investment.
At the COP15 climate conference in Copenhagen (2009), developed countries pledged to mobilize $100 billion per year in climate finance for developing nations by 2020. That target was only met in 2022 — two years late — and independent analysis from the OECD suggests the “100 billion” figure included significant counting of loans at commercial rates and other forms of finance that developing countries do not consider genuine climate support. At COP28 (Dubai, 2023), the New Collective Quantified Goal (NCQG) negotiations sought to replace the $100 billion target with a significantly higher figure — reflecting the reality that developing countries need trillions, not billions, for credible climate transitions.
The Role of Fossil Fuel Subsidies: The $7 Trillion Elephant in the Room
Perhaps the starkest indicator of the gap between climate rhetoric and economic reality is the scale of fossil fuel subsidies. The International Monetary Fund (IMF) estimated in 2023 that global fossil fuel subsidies — both explicit (direct government payments and tax breaks) and implicit (unpriced externalities like air pollution and climate damage) — amounted to a staggering $7 trillion in 2022, equivalent to roughly 7.1% of global GDP. This figure is more than double global investment in renewable energy.
Explicit fossil fuel subsidies alone reached $1 trillion in 2022 according to the IEA — again, a record. These direct financial transfers to fossil fuel producers and consumers represent a massive structural barrier to the energy transition, distorting markets in favor of incumbents and reducing the cost-competitiveness of renewables in many markets. At COP28, countries reached an agreement to “transition away” from fossil fuels — language that, while historic in acknowledging the need to phase out fossil fuels, stopped well short of the binding phase-out commitments climate scientists say are necessary.
Are There Any Bright Spots?
Amid the dismal overall picture, several developments offer genuine grounds for cautious optimism:
- Renewable energy cost collapse: Solar PV costs have fallen 90% since 2010; wind energy costs have fallen 70%. Renewables are now the cheapest source of new electricity generation in most of the world. This cost revolution was largely driven by Chinese manufacturing scale and creates a structural shift that is decoupling electricity growth from emissions growth.
- Electric vehicle acceleration: Global EV sales surpassed 14 million units in 2023, representing approximately 18% of global new car sales — up from less than 1% a decade ago. Several major markets, including Norway (94% EV share) and China (35% EV share), demonstrate rapid transition is feasible.
- Coal decline in developed economies: Coal’s share of US electricity generation fell below 16% in 2023, down from 50% in 2000. The EU retired record coal capacity in 2023. These declines, while offset by growth in Asia, demonstrate structural change in mature economies.
- Methane pledges and satellite monitoring: More than 150 countries signed the Global Methane Pledge at COP26, committing to reduce methane emissions 30% by 2030. Satellite monitoring from MethaneSAT (launched 2024) and other systems is enabling unprecedented accountability for methane leakage from oil and gas operations.
What Would Actual Success Look Like?
Climate scientists and economists broadly agree on what meaningful progress requires: ending new fossil fuel development, rapidly scaling renewable energy to meet 100% of electricity demand in major economies by the mid-2030s, electrifying transportation and heating, decarbonizing industry through green hydrogen and carbon capture, restoring natural carbon sinks, and massively increasing climate finance flows to developing nations. These are technically feasible tasks — the economics increasingly support them. What is lacking is the political will to prioritize them against the concentrated interests of fossil fuel industries and the electoral cycles that truncate politicians’ time horizons.
For deeper analysis of specific dimensions of this challenge, see our web story on US Carbon Capture Policy 2026, our coverage of Corporate Greenwashing, and our investigation of Ocean Carbon Sink Economics. Understanding the specific mechanisms of climate failure is the necessary first step toward the accountability and transformation that survival requires.
The judgment of history on this generation will be harsh if the extraordinary civilizational opportunity represented by this decade is squandered through political timidity, corporate obstruction, and collective action failures. The physics does not negotiate. The window is closing. The question is whether the collective will to act can finally outpace the forces of inertia before the costs of delay become truly unsurvivable.
EU CBAM Duty & Tariff Calculator
Model European Carbon Border Adjustment Mechanism liability, embedded specific emissions, and weekly EU ETS certificate pricing for regulated goods.
Model CBAM Duty →