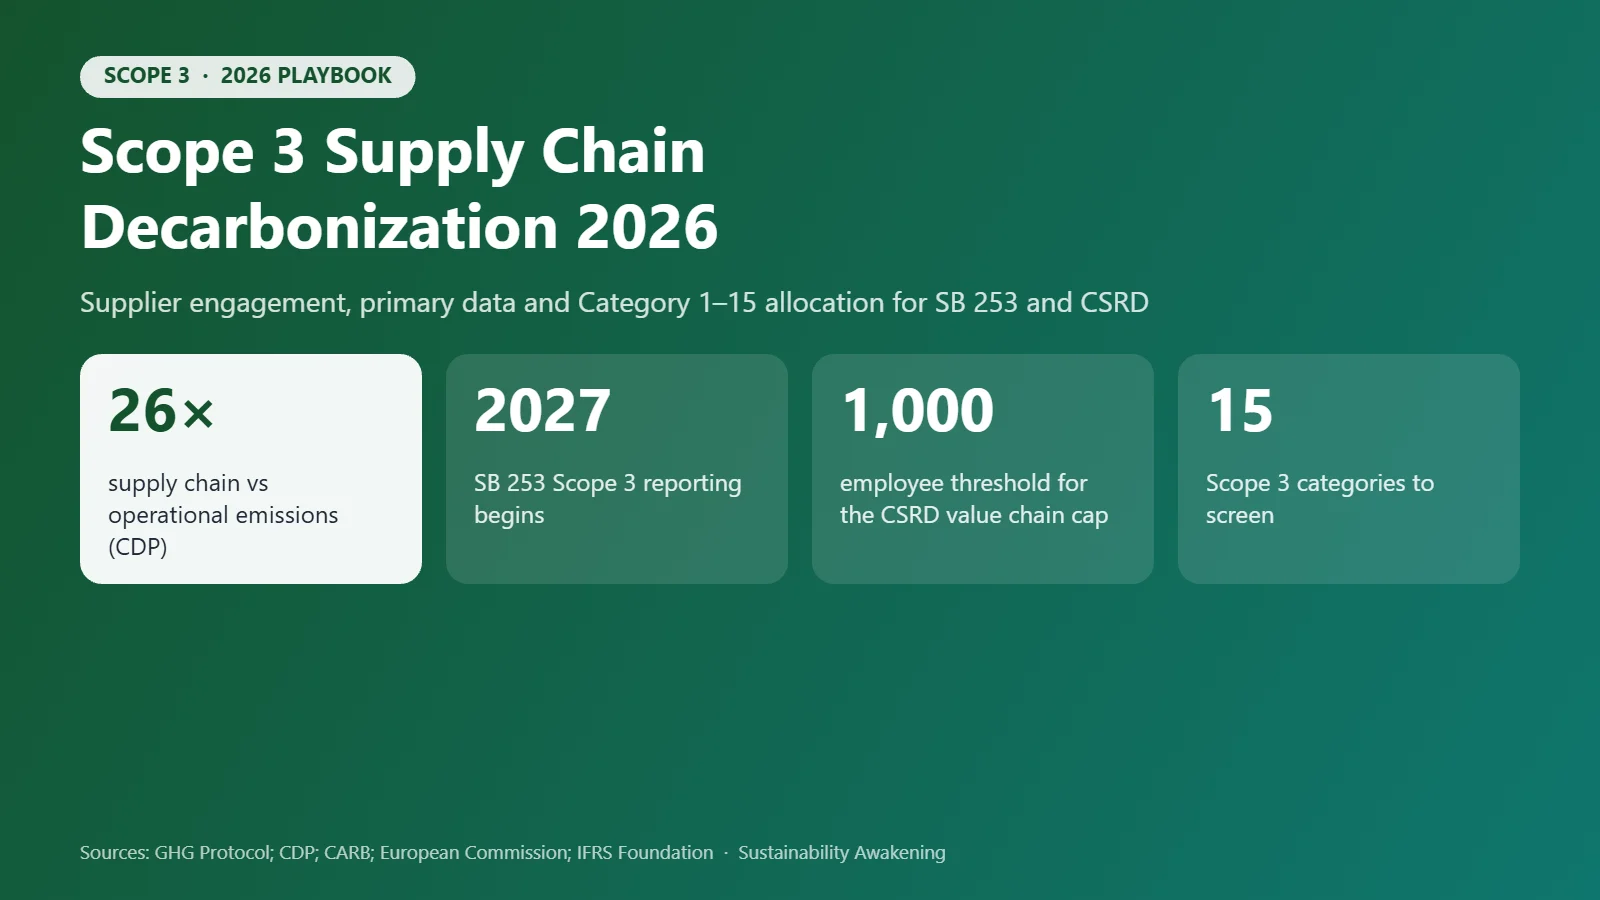
For most companies, the real carbon footprint sits outside their own walls. Scope 3, the emissions in a company’s value chain, usually dwarfs the fuel it burns and the electricity it buys. Until recently, most firms could report it as a rough estimate. In 2026 that is changing: California’s SB 253 schedules Scope 3 reporting from 2027, the EU’s CSRD puts value-chain data in front of auditors, and customers increasingly write emissions data into supply contracts.
This guide is a practical, audit-grade playbook for B2B companies: what each of the 15 categories requires, how to move from spend estimates to supplier data, how suppliers should allocate emissions to customers, how to run an engagement programme that respects the new CSRD value chain cap, and what an assurance provider will ask for. Start with a baseline in our free GHG Emissions Engine, then map which value-chain topics are material with the CSRD Double Materiality Checker.
Short on time? See the 11-slide Scope 3 web story.
- Why Scope 3 is now an audit problem
- The 2026 regulatory map for Scope 3
- The 15 categories: what to measure and how
- The data quality hierarchy: from spend to primary data
- Allocation: turning supplier totals into your Category 1
- Building a supplier engagement programme
- Making Scope 3 audit-grade
- Decarbonisation levers that show up in the numbers
- A 12-month Scope 3 roadmap
- Frequently asked questions
Why Scope 3 is now an audit problem
Supply chains carry most corporate emissions. In CDP’s analysis of 2023 disclosures, companies’ supply chain Scope 3 emissions were on average 26 times larger than their operational Scope 1 and 2 emissions. For a manufacturer, retailer or software company, Category 1 alone often makes up more than half of the total footprint.
That makes Scope 3 a material number, and material numbers attract scrutiny. Three things change when Scope 3 moves from a sustainability report to a regulated filing: the boundary must be documented and stable, every estimate must be traceable to a source and a factor version, and year-on-year changes must be explainable. Spend-based estimates that rise because prices rose, or fall because a supplier was dropped, will not survive that review.
The 2026 regulatory map for Scope 3
| Framework | Who | Scope 3 requirement | Status and timing |
|---|---|---|---|
| California SB 253 | US companies doing business in California with revenue over $1 billion | All relevant Scope 3 categories, GHG Protocol-based | Scope 1–2 due 10 Nov 2026; Scope 3 from 2027, with a good-faith safe harbor and filing-only penalties through 2030 |
| EU CSRD / ESRS E1 | EU companies with more than 1,000 employees and €450M turnover; certain non-EU groups | Gross Scope 3 by significant category, with limited assurance | Revised ESRS delegated acts finalised 3 Jul 2026; value chain cap on supplier requests |
| ISSB IFRS S2 | Where adopted by jurisdictions | Scope 3 by category, with transition reliefs | Dec 2025 amendments let entities limit Category 15 to financed emissions |
| SBTi near-term targets | Voluntary | Scope 3 target when Scope 3 is a large share of emissions | Corporate Net-Zero Standard V2 transition under way |
| SEC climate rule | US listed companies | None: Scope 3 was dropped from the 2024 final rule | Stayed since Apr 2024; rescission proposed May 2026 |
Sources: CARB; European Commission; IFRS Foundation (11 Dec 2025); SEC press release 2026-49. Check thresholds and dates against the primary texts for your entity.
Two developments matter most for supply chains. First, the CSRD value chain cap: under Omnibus I, a CSRD reporter may not require suppliers with 1,000 or fewer employees to provide more than the voluntary VSME standard covers (European Commission explanation). Second, the standard itself is moving: the GHG Protocol and ISO announced in July 2026 that they will merge their corporate standards, including Scope 3, into one co-branded standard, with an integrated public consultation planned for the second quarter of 2027. The current Scope 3 Standard remains the basis for reporting until then.
Southeast Asian supply chains
If you report from Singapore, much of your Scope 3 probably sits with suppliers in Malaysia and Indonesia.
- Reporting: Singapore STI constituents add Scope 3 from FY2026 under ISSB-based rules. For other listed companies it is voluntary.
- Carbon tax gap: Singapore’s S$45 per tonne carbon tax covers only direct emissions at large local facilities. It does not reach supplier emissions across the border.
- Grid effect: Suppliers there often run on more coal-heavy grids than Singapore’s gas-fired system, so supplier-specific electricity data can move a Category 1 total a lot.
The 15 categories: what to measure and how
The GHG Protocol splits value-chain emissions into 15 categories. You must screen all of them, report those that are relevant, and explain any exclusions. The table shows the typical data source and preferred method for each.
| # | Category | Typical data source | Preferred method | Often material for |
|---|---|---|---|---|
| 1 | Purchased goods and services | Procurement spend, bills of materials, supplier data | Supplier-specific or product footprints; spend-based to screen | Almost everyone |
| 2 | Capital goods | Capex ledger, asset register | Supplier or LCA data for major assets | Manufacturing, data centres, utilities |
| 3 | Fuel- and energy-related | Scope 1–2 activity data | Well-to-tank and grid-loss factors | Energy-intensive firms |
| 4 | Upstream transport | Freight invoices, tonne-km | Distance-based (ISO 14083) | Retail, manufacturing |
| 5 | Waste in operations | Waste contractor reports | Waste-type factors | Food, manufacturing |
| 6 | Business travel | Travel management data | Distance-based | Services |
| 7 | Employee commuting | Surveys, HR data | Average-data | Large workforces |
| 8 | Upstream leased assets | Lease records, meter data | Asset-specific | Firms leasing space or fleets |
| 9 | Downstream transport | Distributor data | Distance-based | Consumer goods |
| 10 | Processing of sold products | Customer process data | Average-data | Intermediate goods |
| 11 | Use of sold products | Product energy use, lifetime | Direct-use-phase modelling | Vehicles, appliances, fuels |
| 12 | End-of-life of sold products | Material composition | Waste-type factors | Packaging, electronics |
| 13 | Downstream leased assets | Lessee data | Asset-specific | Real estate |
| 14 | Franchises | Franchisee data | Franchise-specific | Retail, hospitality |
| 15 | Investments | Portfolio holdings | PCAF financed emissions | Banks, insurers, investors |
Source: GHG Protocol Corporate Value Chain (Scope 3) Standard. Category guides: see our Category 2 and Category 4 deep dives linked below.
For deeper method guides, see Category 2 capital goods and Category 4 freight under ISO 14083. Fleet fuel is Scope 1, not Scope 3, unless the vehicles are owned by a contractor; our EV fleet TCO guide covers that boundary.
The data quality hierarchy: from spend to primary data
Scope 3 methods form a hierarchy. Auditors and target-setters expect you to move up it over time for the suppliers and categories that matter most.
| Method | What it uses | Typical uncertainty | Shows supplier reductions? | Use it for |
|---|---|---|---|---|
| Supplier-specific product footprint | Cradle-to-gate footprint per unit, e.g. PACT-conformant | Low | Yes | Top suppliers by emissions |
| Supplier allocation (hybrid) | Supplier’s Scope 1–2 (and upstream) allocated to you | Low to medium | Yes | Strategic suppliers without product footprints |
| Average-data | Quantities (kg, kWh, tonne-km) × industry-average factors | Medium | Partly | Materials and logistics with physical data |
| Spend-based (EEIO) | Spend by sector × EEIO factor (e.g. USEEIO, CEDA, EXIOBASE) | High | No | Screening and the long tail |
Uncertainty labels are qualitative. Disclose the share of each category calculated with each method.
Product-level data is becoming exchangeable. The WBCSD’s Partnership for Carbon Transparency published PACT Methodology Version 3 in June 2026, with a matching technical specification for exchanging product carbon footprints between companies’ systems. Asking suppliers for PACT-conformant footprints avoids each customer inventing its own questionnaire. In the US, EPA’s USEEIO models and the supply chain emission factors derived from them remain the standard public spend-based source.
Allocation: turning supplier totals into your Category 1
When a supplier cannot provide product footprints, the next-best option is allocating the supplier’s own emissions to its customers. The supplier’s choice of allocation key determines what you receive, so agree it explicitly.
| Approach | Calculation | Result for you |
|---|---|---|
| Spend-based | $4.0M spend × 0.45 kg CO2e per $ (illustrative EEIO factor) | 1,800 t CO2e |
| Revenue allocation | Supplier Scope 1–2 of 12,000 t × ($4.0M ÷ $80M revenue = 5%) | 600 t CO2e |
| Physical allocation | 12,000 t × (2,000 t of product shipped to you ÷ 50,000 t total = 4%) | 480 t CO2e |
Illustrative numbers. Revenue allocation omits the supplier’s own upstream (its Scope 3); ask for cradle-to-gate data where that upstream is large.
Three rules keep allocation defensible. Prefer physical keys (mass, units, energy) over revenue where products are similar, because revenue shares move with prices. Make sure allocated shares across all customers add up to the supplier’s total, which prevents double-counting. And document the key, the supplier’s reporting year and any assurance it has, so your auditor can trace the figure.
Building a supplier engagement programme
Effective programmes treat suppliers in tiers. Typically 20 to 50 suppliers account for most Category 1 and 4 emissions, so concentrate effort there.
| Tier | Who | What you ask for | What you offer |
|---|---|---|---|
| Strategic | Top suppliers covering about 70–80% of supply-chain emissions | Product footprints (PACT), Scope 1–3 inventory, a reduction target, annual data | Joint reduction projects, longer contracts, co-funded renewables |
| Core | The next tier by emissions or spend | Scope 1–2 inventory and allocation to you; CDP or VSME disclosure | Templates, training, a shared platform |
| Long tail | Everyone else | Nothing mandatory; spend-based estimates | Self-service guidance and tools |
For EU CSRD reporters, requests to suppliers with 1,000 or fewer employees cannot exceed VSME content.
- Map hotspots. Run a spend-based screen across all categories to find the suppliers and materials that matter.
- Write data into contracts. New and renewed contracts can include annual emissions data, an allocation method and audit rights, within the value chain cap where it applies.
- Standardise the ask. Use one format (PACT for products, CDP or VSME for company-level data) instead of bespoke questionnaires.
- Score and reward. Add carbon criteria to supplier scorecards and tender evaluations, and give strategic suppliers a reason to invest.
- Close the loop. Share back how each supplier’s data changed your inventory, so they see reductions recognised.
Making Scope 3 audit-grade
Limited assurance, required under the CSRD and phasing in under SB 253, tests whether reported figures are supported, consistent and free of material error. For Scope 3, auditors typically look for:
- A documented boundary and screening of all 15 categories, with reasons for exclusions.
- Data lineage from each reported number back to source documents, factors and calculations.
- Factor version control, so you can say which EEIO or LCA database and year was used.
- A recalculation policy: many companies restate the base year when structural or method changes move emissions by 5% or more.
- Estimation disclosure, showing the share of each category based on primary versus secondary data.
- Controls on supplier data: plausibility checks, reporting-year matching and evidence of supplier assurance where claimed.
Spreadsheets struggle with lineage and version control at scale, which is why assurance readiness is the heaviest criterion in our enterprise carbon accounting software comparison.
Scope 3 at a glance
Key numbers and dates for supply chain decarbonisation in 2026.
Decarbonisation levers that show up in the numbers
Only reductions that reach your data count. If Category 1 is spend-based, a supplier switching to renewable power changes nothing in your inventory. That is why the levers below go hand in hand with better data.
- Supplier renewable electricity, through supplier power purchase agreements or aggregated buying programmes.
- Material substitution: recycled or low-carbon steel, aluminium, cement and plastics, captured through product footprints.
- Design changes that cut material use or extend product life, reducing Categories 1, 11 and 12.
- Logistics: mode shift from air to sea or road to rail, better load factors and lower-emission carriers, measured under ISO 14083.
- Procurement criteria that weight carbon in tenders. For imports into the EU, embedded emissions also carry a cost under CBAM; see our CBAM calculator.
Buildings in the value chain. Leased offices and tenant spaces show up in Categories 8 and 13, and in New York those buildings face their own carbon caps. Our Local Law 97 penalty modeler shows how heat pumps, lighting and envelope upgrades change a building’s emissions and penalties; the LL97 guide covers the 2030 limits.
A 12-month Scope 3 roadmap
| Months | Milestone | Output |
|---|---|---|
| 1–2 | Screen all 15 categories with spend and activity data | Baseline and hotspot map |
| 3–4 | Fix boundary, methods, factor sources and recalculation policy | Scope 3 methodology note |
| 4–6 | Engage strategic suppliers; agree allocation keys and formats | Primary data for the top tier |
| 6–9 | Move top categories to hybrid or supplier-specific methods | Higher primary-data share |
| 9–11 | Dry-run assurance on one category | Findings and fixes |
| 12 | Set or refresh a Scope 3 target and supplier programme | Board-approved plan |
Timelines assume an existing Scope 1–2 inventory. Large multinationals typically need two cycles to reach assurance-ready Scope 3.
Frequently asked questions
What are the 15 categories of Scope 3 emissions?
Under the GHG Protocol Corporate Value Chain (Scope 3) Standard there are eight upstream categories: 1 purchased goods and services, 2 capital goods, 3 fuel- and energy-related activities, 4 upstream transportation, 5 waste, 6 business travel, 7 employee commuting and 8 upstream leased assets. There are seven downstream categories: 9 downstream transportation, 10 processing of sold products, 11 use of sold products, 12 end-of-life treatment of sold products, 13 downstream leased assets, 14 franchises and 15 investments.
When do companies have to report Scope 3 under California SB 253?
Scope 3 reporting under SB 253 is scheduled to begin in 2027, after the first Scope 1 and Scope 2 reports due on 10 November 2026. The law includes a safe harbor: Scope 3 disclosures made in good faith are protected from misstatement penalties, and through 2030 penalties for Scope 3 apply only to failing to file.
Does the SEC require Scope 3 emissions disclosure?
No. The SEC’s March 2024 climate rule dropped Scope 3 from its final text, was stayed in April 2024 and never took effect, and in May 2026 the SEC proposed to rescind it. For US companies, the practical Scope 3 drivers are California SB 253, customer requests, CDP, science-based targets and, for EU-linked groups, the CSRD.
What is the CSRD value chain cap?
Under the Omnibus I changes to the CSRD, companies reporting under the directive may not require suppliers and other value-chain partners with 1,000 or fewer employees to provide more information than the voluntary VSME standard covers. Reporters can still estimate those suppliers’ emissions and can ask for more on a voluntary basis, but they cannot make it a requirement.
How accurate is spend-based Scope 3 accounting?
Spend-based accounting multiplies what you spend in each sector by an average emission factor from an environmentally extended input-output (EEIO) model. It is fast and complete, but it cannot show reductions made by your own suppliers and it moves with prices. Use it to screen and to fill gaps, then replace it with supplier-specific or product-level data for the 20 to 50 suppliers that drive most of your footprint.
Sources
- GHG Protocol, Corporate Value Chain (Scope 3) Standard
- GHG Protocol, Announces Key Standard Development Updates (29 Jul 2026)
- GHG Protocol, Scope 3 Standard Revisions Phase 1 Progress Update (31 Mar 2026)
- CDP, Corporates’ supply chain Scope 3 emissions are 26 times higher than their operational emissions (2024)
- European Commission, explanatory information regarding the value chain cap (6 May 2026)
- California Air Resources Board, Corporate Disclosure of Climate Data
- IFRS Foundation, ISSB issues targeted amendments to IFRS S2 (11 Dec 2025)
- WBCSD, PACT Methodology Version 3 (Jun 2026)
- US EPA, US Environmentally-Extended Input-Output (USEEIO) models
- US SEC, proposed rescission of climate-related disclosure rules (May 2026)
This guide is for general information and is not legal or assurance advice. Confirm obligations for your entity against the primary regulatory texts.
Water Footprint Impact Calculator
Measure direct and virtual water consumption across household, agricultural, and industrial supply chains against regional watershed stress metrics.
Calculate Water Footprint →