Hundreds of glaciers that shaped the mountains of the American West for thousands of years have vanished within a single human lifetime. A new inventory published in the Proceedings of the National Academy of Sciences (PNAS) finds that more than a quarter of the glaciers mapped in the lower 48 states in the mid-twentieth century are gone, and that a third of the region’s glacier ice has melted.
This guide sets out what the study found, which ranges lost the most, why the melt is accelerating, and what it means for late-summer water, fish and mountain safety. The 11-slide web story gives the short version.
- The headline numbers
- Range by range: where the ice went
- Why counts of lost glaciers differ
- Why the glaciers are melting faster
- What glacier loss means for water and wildlife
- New hazards as ice disappears
- What happens next
- Frequently asked questions
The headline numbers
Andrew Fountain, a glaciologist at Portland State University, and colleagues Bryce Glenn, Christopher McNeil and Brian Menounos compared US Geological Survey (USGS) glacier outlines drawn on topographic maps between the early 1950s and the mid-1980s with an inventory built from aerial and satellite images taken around 2015. The results were published in PNAS in October 2026.
| Measure | Mid-twentieth century | About 2015 | Change |
|---|---|---|---|
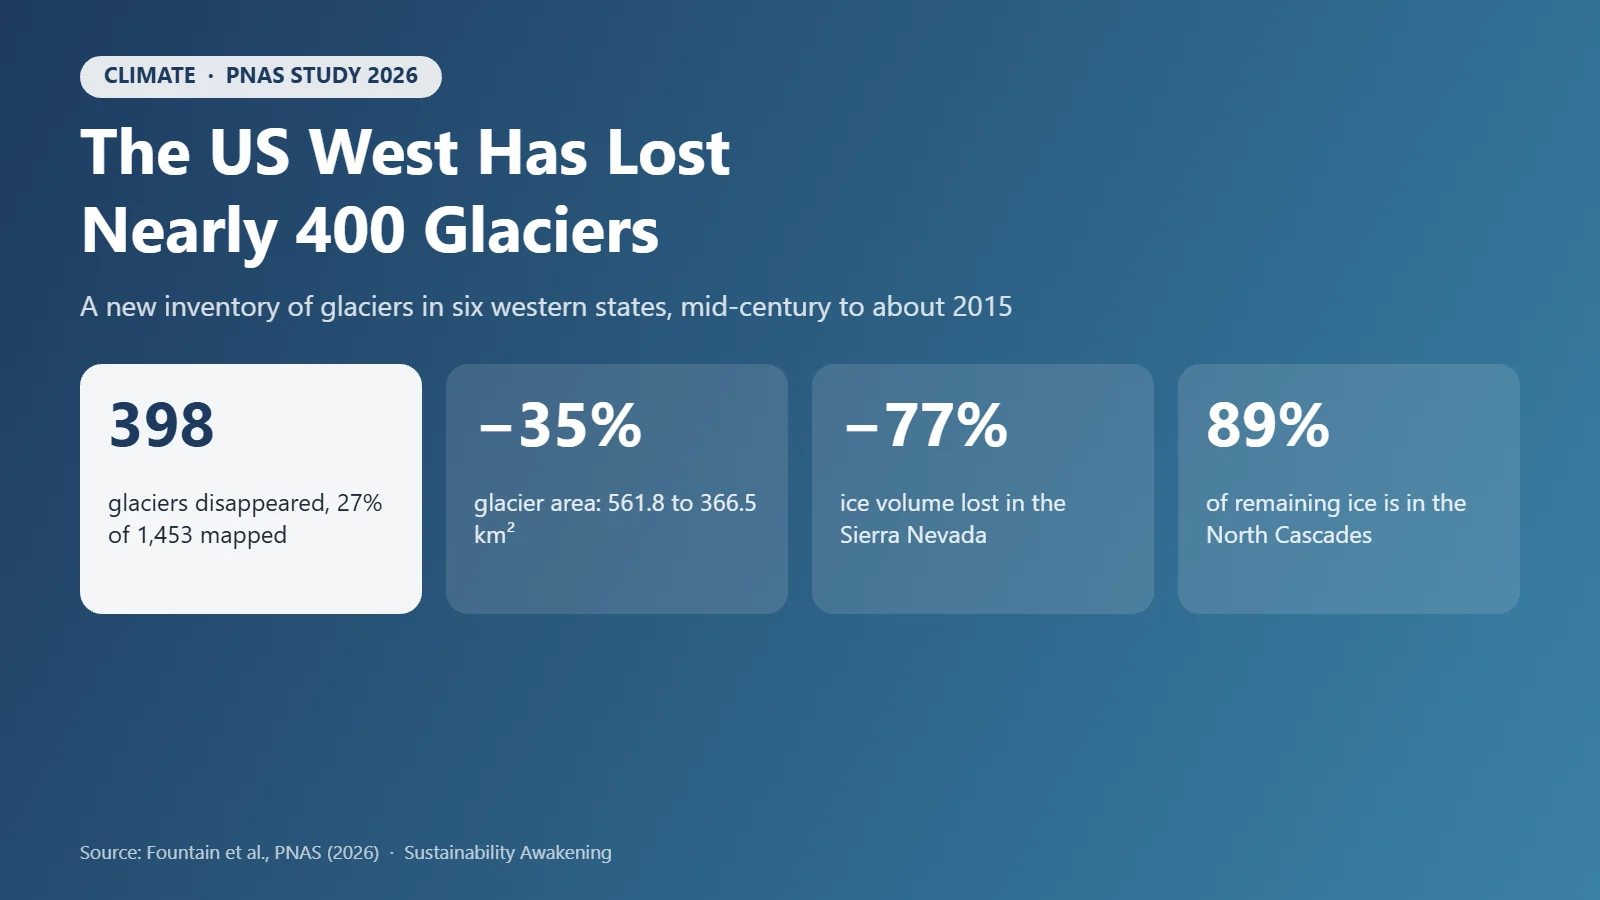
| Glaciers mapped | 1,453 | 1,331* | 398 disappeared (−27%) |
| Glacier area | 561.8 km² (216.9 mi²) | 366.5 km² (141.5 mi²) | −35% |
| Estimated ice volume | 19.7 km³ | 13.2 km³ | −33% |
| Average glacier size | — | 0.35 km² (about 86 acres) | Small glaciers shrank about two-thirds |
| Share of remaining ice in the North Cascades | — | ~89% | 11.6 km³ |
*The 2015 count includes glaciers that split into several pieces as they retreated, which each received a new entry. Sources: Fountain et al., PNAS (2026); Earth.com summary.
To put that in perspective, all the glaciers left in six western states now cover less ground than the roughly 415 square kilometres of glaciers in Austria alone.
Range by range: where the ice went
The losses are uneven. Small, south-facing glaciers at lower elevations have fared worst, particularly those below about 9,000 feet in the Sierra Nevada and below about 6,000 feet in the Cascades.
| Range | Glaciers then → now | Ice change | Notes |
|---|---|---|---|
| Sierra Nevada, CA | 94 → 64 | Area 12.2 → 4.4 km²; volume −77% | Could lose all glaciers this century |
| Beartooth–Absaroka, MT | — | Volume −77%; thinned 16 m on average | Fastest thinning of any range with 10+ glaciers |
| Wind River Range, WY | 116 → 74 | — | Largest glacier group in the Rockies |
| Lewis Range, MT (Glacier NP) | 176 → 145 | — | Boulder Glacier no longer counts as a glacier |
| Oregon Cascades | 53 → 42 | Kept just over a third of its area | Includes Mount Hood |
| Northern Cascades, WA | 668 → 706* | Area 263 → 176 km² | *Count rose as glaciers split |
| Southern Cascades, WA (Rainier) | — | Volume −13%; thinned 7.2 m | Least thinning |
| Bighorn Mountains, WY | 3 left | Thinned 36 m | — |
| Cabinet Mountains, MT | 2 → 0 | Gone | — |
Source: Fountain et al., PNAS (2026), as summarised by Earth.com (18 Oct 2026).
Montana’s Glacier National Park is the best-known example. Boulder Glacier, photographed around 1910 from Chapman Peak, had shrunk below 0.1 square kilometres (about 25 acres) by 1998, the threshold below which USGS no longer classes ice as a glacier.
Why counts of lost glaciers differ
Readers may see different numbers. The PNAS paper counts 398 glaciers as disappeared. The Guardian reports “about 300” as functionally gone, meaning they have shrunk to roughly the size of two football fields and no longer move under their own weight. Both describe the same trend; the difference lies in the definition of when a shrinking ice patch stops being a glacier.
Counts can also rise. In Washington’s northern Cascades the number of glaciers went up from 668 to 706 because retreating ice split into separate lobes, each recorded on its own, even though the range lost a third of its ice area. That is why area and volume are better measures of loss than counts.
Why the glaciers are melting faster
Fountain describes a “double whammy”. Summers are hotter, so glaciers lose more ice, and winters increasingly bring rain rather than snow, so they gain less. Since the old maps were drawn, the elevation holding the most ice has moved about 50 metres uphill.
The mid-century maps were drawn during a relatively cool, stable period for western glaciers, which makes the subsequent decline stark. The authors also note that avalanching and wind-drifted snow can roughly double the snow reaching small glaciers in shaded cirques, which is why some survive in north-facing niches while their sunnier neighbours vanish.
Natural climate swings play a part year to year. Strong El Niño winters, for example, tend to bring less snow to the Pacific Northwest, as our ENSO guide explains. But the long-term trend tracks global warming caused by fossil-fuel emissions.
What glacier loss means for water and wildlife
Glaciers supply only a small share of western water compared with seasonal snowpack, but they release it at a critical time: the hottest, driest weeks of late summer, after the snow has gone. That cold meltwater keeps alpine streams flowing and cool enough for species such as bull trout. “Once you lose your seasonal snow, the only source of water in these alpine areas is glacier melt,” Fountain said in an earlier study of the Olympic Peninsula, where glaciers are expected to have largely disappeared by 2070.
Glacier retreat is also a visible signal of shrinking snowpack, which supplies much of the West’s drinking and irrigation water, as our coverage of the 2026 US drought and Lake Powell shows. Some hydropower systems in the Cascades also draw on glacier-fed rivers; see our guide to hydropower’s ecological impacts.
New hazards as ice disappears
Disappearing ice can leave unstable ground. As glaciers thin, the rock walls they once buttressed can fail, and meltwater lakes can burst. The Guardian reports that a glacier and bedrock collapse on the Tibet–Nepal border in August 2026 killed at least 1,400 people. Glaciologist Eric Rignot of the University of California, Irvine warned that climbing seasons in the Alps are already shortening because the terrain is too dangerous.
At the poles the stakes are global: about 12.5 trillion tons of ice from Greenland and Antarctica has melted since 1979, raising global sea levels by about an inch, according to a study cited by the Guardian.
Lower 48 glaciers at a glance
Key figures from the October 2026 PNAS inventory of glaciers in six western states.
What happens next
Fountain expects many of the remaining glaciers to be gone by 2100, surviving in diminished form only on the tallest peaks such as Mount Rainier and Mount Hood. Worldwide, scientists expect annual glacier losses to peak around the middle of this century.
Two caveats from the study matter. Old map elevations can be off by about 5 metres, and seasonal snow in the radar data used for new elevations would make measured losses smaller than the real ones. Global ice models also give volumes 5% to 49% higher than the paper’s estimate, so the authors call for direct ice-thickness surveys.
The loss can be slowed, not reversed on any human timescale. That means cutting emissions now, planning water supplies for a West with less snow and ice, and preparing mountain communities for new hazards. Individuals can start by measuring their own emissions with our Carbon Footprint Calculator; organisations can use the GHG Emissions Engine for Scope 1, 2 and 3.
Frequently asked questions
How many glaciers has the US West lost?
A 2026 study in the Proceedings of the National Academy of Sciences (PNAS) led by Andrew Fountain of Portland State University found that 398 of the 1,453 glaciers mapped in the lower 48 states in the mid-twentieth century, about 27%, had disappeared by around 2015. The Guardian, reporting on the study, describes about 300 as having functionally disappeared, meaning they shrank to roughly the size of two football fields and stopped moving.
How much glacier ice is left in the lower 48 states?
Total glacier area fell by about 35%, from 561.8 to 366.5 square kilometres, and estimated ice volume fell from about 19.7 to 13.2 cubic kilometres. Around 89% of the remaining ice is in Washington’s North Cascades.
Which US mountain ranges have lost the most glacier ice?
The Sierra Nevada in California and the Beartooth-Absaroka ranges in southern Montana each lost about 77% of their glacier volume. The Sierra Nevada went from 94 glaciers to 64 and from 12.2 to 4.4 square kilometres of ice.
Why are glaciers in the western US melting?
Rising temperatures caused by burning fossil fuels mean glaciers melt more in hotter summers, while more winter precipitation falls as rain instead of snow, so they are not replenished. Small, low-elevation and sun-exposed glaciers shrink fastest.
Will US glaciers outside Alaska disappear?
Many will. Andrew Fountain expects a large share of today’s glaciers in the lower 48 to be gone by 2100, with survivors limited to the highest peaks such as Mount Rainier and Mount Hood. Cutting greenhouse gas emissions can slow the loss, but regrowing glaciers would take centuries.
Sources
- Fountain, Glenn, McNeil and Menounos, Extensive glacier loss in the coterminous United States, PNAS (2026)
- The Guardian, The US west has lost nearly 300 glaciers since the 1960s (23 Oct 2026)
- Earth.com, Nearly 400 glaciers have vanished from the American West (18 Oct 2026)
- US Geological Survey, Retreat of glaciers in Glacier National Park
Water Footprint Impact Calculator
Measure direct and virtual water consumption across household, agricultural, and industrial supply chains against regional watershed stress metrics.
Calculate Water Footprint →