2026 Hurricane Season Forecast: 5 Shocking Structural Changes
As global climate systems undergo rapid thermodynamic transformations, meteorological organizations must aggressively adapt their predictive frameworks. For coastal and inland communities, the 2026 hurricane season forecast represents a pivotal, systemic shift in how we understand and prepare for extreme weather events. The National Oceanic and Atmospheric Administration (NOAA) has recently unveiled a suite of product improvements that fundamentally alter the communication of storm-related hazards.
These updates are not merely aesthetic adjustments to weather maps. They are necessary evolutionary steps driven by shifting climatic baselines and the increasing frequency of rapid-intensification events. Understanding these changes is critical for urban planners, agricultural economists, and coastal residents alike.
Table of Contents
The Evolution of the 2026 Hurricane Season Forecast
The traditional approach to forecasting tropical cyclones has historically focused on coastal impact zones, often neglecting the sustained danger these systems pose as they move inland. However, the operational parameters defining the 2026 hurricane season forecast are drastically expanding. The National Hurricane Center is implementing comprehensive adjustments to its primary public-facing graphics.
For the first time, the operational hurricane track cone map will fully incorporate inland tropical storm and hurricane watches and warnings. This integration follows a highly successful experimental phase conducted in previous years. It was determined that isolated coastal warnings were insufficient for public safety, given the extensive inland penetration of modern storm systems.
By unified shading across the entire five-day outlook cone, the visual communication of threat levels becomes significantly clearer. The revised legend will now explicitly depict areas where combined hazards exist, utilizing diagonal pink and blue lines to indicate overlapping watches and warnings. This ensures that populations far removed from the initial landfall site remain appropriately vigilant.
Understanding the New Elliptical Track Cone
Perhaps the most scientifically profound alteration to the 2026 hurricane season forecast is the introduction of the experimental elliptical track cone. Since its inception in 2002, the traditional cone of uncertainty relied on a series of circles to project a storm’s probable path based on historical error rates. While effective for decades, this circular model failed to accurately convey the nuanced variances in a storm’s forward speed versus its directional deviation.
Beginning in 2026, the experimental cone will utilize ellipses anchored at each forecast point. This geometric shift allows forecasters to capture a much broader, more accurate range of possibilities regarding both the velocity and trajectory of a tropical cyclone. By transitioning from circles to ellipses, meteorologists can visually decouple directional errors from speed errors.
Furthermore, this experimental cone will encapsulate 90% of forecast track possibilities. This is a substantial increase from the traditional 67% forecast error margin used in previous iterations. While technical issues may occasionally affect the availability of this experimental graphic, its implementation marks a massive leap forward in communicating statistical probability to the general public.
Bridging the Gap: Systemic Climate Patterns and Ocean Thermodynamics
To fully grasp why these forecasting upgrades are necessary, we must look beyond the immediate meteorology and examine the broader systemic climate patterns at play. The intensification of storms tracked in the 2026 hurricane season forecast is directly linked to the escalating thermal capacity of the world’s oceans. As global average temperatures rise, marine environments absorb a vast majority of this excess heat.
This increased oceanic heat content acts as high-octane fuel for tropical cyclones. It raises the thermodynamic speed limit of storms, facilitating rapid intensification events where wind speeds increase exponentially just hours before landfall. You can read more about how shifting global currents impact seasonal weather in our comprehensive El Nino 2026 Outlook.
When sea surface temperatures deviate drastically from historical averages, traditional forecasting models based on past decades of data begin to lose their predictive edge. The Intergovernmental Panel on Climate Change has extensively documented these atmospheric shifts, noting that extreme weather events will become more frequent and severe. NOAA’s shift to a 90% error margin ellipse is a direct statistical response to this heightened atmospheric volatility.
Hawaii’s New Storm Surge Alerts
While the continental United States often dominates hurricane discourse, the Pacific basin faces unique and escalating threats. A critical component of the 2026 hurricane season forecast is the expansion of specialized products for the Hawaiian Islands. Historically, precise storm surge mapping was largely concentrated on the U.S. East Coast and the Gulf of Mexico.
NOAA is now rolling out dedicated storm surge watches, warnings, and peak storm surge graphics for Hawaii. These tools will deliver highly accurate, probability-based forecasts of water levels within 72 hours of expected hurricane impacts. This is a monumental upgrade for island communities where topography and bathymetry interact to create highly localized, devastating flooding scenarios.
The models generating these Hawaiian storm surge alerts will incorporate a complex array of forecast inputs. These include the precise storm track, maximum wind intensity, and the expanding radii of the storm’s wind field. By making these advanced metrics publicly available for the main Hawaiian Islands, local emergency management can execute highly targeted evacuation protocols, saving both lives and critical infrastructure.
Data Comparison: Traditional vs. 2026 Forecasting Models
To clearly illustrate the paradigm shift occurring in meteorology, it is helpful to contrast the legacy systems with the new protocols. The following table breaks down the fundamental differences driving the latest predictive methodologies.
Feature / Metric
Traditional Track Cone (Pre-2026)
New 2026 Experimental Track Cone
Shape of Forecast Points
Circles
Ellipses
Error Margin Captured
67% of historical forecast errors
90% of forecast track possibilities
Inland Hazard Display
Often disjointed from main coastal cone
Fully incorporated watches/warnings
Error Decoupling
Speed and direction combined
Speed and direction errors separated
Hawaii Surge Products
Limited to general text advisories
Probability-based peak surge graphics
This table clearly demonstrates how the 2026 hurricane season forecast prioritizes higher statistical inclusion and visual clarity. By capturing 90% of possibilities, the new model intentionally trades a narrow, potentially misleading trajectory for a scientifically rigorous representation of climatic uncertainty.
Ecological Economics: The Cost of Extreme Weather Forecasting
The updates to the 2026 hurricane season forecast carry profound implications for the field of ecological economics. When extreme weather tracking is inaccurate, the financial and environmental tolls are catastrophic. Misjudging the inland penetration of a tropical cyclone leads to delayed supply chain shutdowns, massive inventory losses, and inadequate mobilization of disaster relief funds.
By providing a more accurate, inclusive visualization of inland hazards, NOAA is essentially offering a more precise risk-assessment tool for insurance markets and regional economies. When businesses and municipalities can rely on a 90% confidence interval, they can optimize their resource allocation. This prevents the costly over-preparation of unaffected zones while ensuring maximum readiness in true impact vectors.
Furthermore, understanding the expanding radius of these storms is crucial for long-term urban planning. As we outline in our analysis on Climate Resilient Infrastructure Planning, building codes and zoning laws must evolve in tandem with meteorological data. The new elliptical cones will provide city planners with the exact statistical justification needed to mandate stricter building standards further inland.
Preparing Agricultural Systems for Inland Wind Hazards
Agriculture represents one of the most vulnerable sectors to systemic climate volatility. The integration of inland warnings into the 2026 hurricane season forecast provides a critical buffer for agricultural systems. When a tropical cyclone moves over land, it brings not only high winds but torrential rainfall that can decimate crop yields and strip vital topsoil.
Soil Salinization: Storm surges push saltwater far inland, severely degrading soil quality and rendering land infertile for subsequent planting seasons.
Infrastructure Collapse: High-velocity winds destroy localized agricultural infrastructure, including silos, irrigation networks, and greenhouse complexes.
Livestock Threats: Rapid, unexpected inland flooding traps livestock, causing massive economic and ethical crises for regional farming communities.
With the new forecast cone explicitly highlighting overlapping inland watches and warnings, agricultural economists and farm managers have actionable data. They can preemptively harvest mature crops, secure loose equipment, and relocate livestock to higher elevations. This early-warning capacity bridges the gap between raw meteorological data and on-the-ground food security.
Conclusion and Future Trajectories
The enhancements defining the 2026 hurricane season forecast represent a necessary adaptation to an increasingly volatile global climate system. By transitioning to elliptical probability models, expanding inland hazard communication, and introducing Hawaiian storm surge alerts, NOAA is drastically improving public safety frameworks. These changes acknowledge that modern tropical cyclones are not just coastal events, but massive systemic disruptions.
As oceanic temperatures continue to influence atmospheric thermodynamics, we must rely on these advanced, data-driven tools to protect our communities, our economies, and our agricultural lifelines. The shift from a 67% to a 90% confidence interval is a stark reminder of the widening uncertainty inherent in our changing climate.
Understanding these forecasting mechanisms is the first step toward true systemic resilience. Will you be updating your community’s emergency response plans to reflect these new elliptical forecasting models?
Cooling Rivers and Streams Could Save Overheated Fish: Inside a New Effort to Cool Warming Waters
Rivers and streams across the United States are warming faster than many fish species can adapt. As summers grow hotter and low-flow periods lengthen, cold-water fish—especially salmon, trout, and other temperature-sensitive species—face rising mortality. In response, scientists, tribes, local governments, and conservation groups are exploring a surprising climate adaptation strategy: actively cooling rivers.
This is not a gimmick. It’s an emerging systems-level intervention where “air-conditioning rivers” is becoming a serious tool to protect aquatic ecosystems stressed by climate change.
This article explains how it works, why it matters, and what it reveals about the future of climate resilience in U.S. freshwater systems.
Table of Contents
Why Rivers Are Overheating: The Systemic Causes
River warming is driven by converging climate and land-use pressures:
1. Rising air temperatures
Heatwaves now last longer and produce more extreme daytime highs. Rivers respond quickly to air-temperature spikes, particularly shallow streams.
2. Declining snowpack and altered melt timing
In many western U.S. watersheds, snowfall is lower and melts earlier—meaning summer flows are lower and warmer.
3. Loss of shade from deforestation and wildfire
Burned or cleared riparian zones expose water to direct sun, removing a natural cooling mechanism.
4. Reduced groundwater mixing
Irrigation withdrawals and development can lower water tables, reducing the cold seepage that historically kept streams cool during warm months.
5. Urban heat influence
Impervious surfaces and warm stormwater runoff raise stream temperatures in urbanized regions.
Together, these pressures push many rivers beyond the thermal tolerance of sensitive species—especially salmonids, which struggle when temperatures exceed 68°F (20°C).
What “Cooling Rivers” Actually Means
Multiple experimental and early-stage field practices are emerging across the U.S.:
✔ Targeted Cold-Water Injection
Pumping cold groundwater or chilled water into critical habitat zones during heatwaves.
✔ Engineered Shade Structures
Using temporary shade cloths, floating vegetation mats, or anchored canopy structures to reduce solar heating.
✔ Restoring Riparian Forests
One of the most effective long-term cooling strategies, though slow to mature.
✔ Reconnecting Floodplains
Restores natural mixing of cooler groundwater and reduces heat buildup in narrow channels.
✔ Increasing Deep-Pool Habitat
Engineering deeper refuge pools gives fish a place to escape high temperatures.
✔ “Thermal Refugia Mapping”
Tribes, universities, and agencies are mapping cold pockets—micro-zones fed by springs or tributaries—and protecting them during critical migration periods.
These are climate adaptation strategies—not substitutes for emissions reduction—but increasingly necessary to maintain functioning river ecosystems in a warmer world.
Why Cooling Matters: Fish Physiology in a Hotter Climate
Most freshwater fish are ectothermic; water temperature determines metabolic rate, immunity, and survival. Even small temperature increases can:
raise disease susceptibility
reduce oxygen availability
stress immune systems
impair migration ability (especially salmon)
affect spawning timing and egg survival
In some U.S. rivers, temperatures are hitting lethal thresholds for salmon during peak migration. Cooling interventions aim to give species “thermal breathing room”—not to fully reverse warming but to reduce acute stress events.
Where These Experiments Are Happening
Pacific Northwest
Tribes and state agencies are pioneering cold-water refugia protection for salmon, especially in the Columbia and Klamath River basins.
Northeast
Brook trout restoration now includes targeted shading, thermal mapping, and strategic land acquisition near cold-water tributaries.
Rocky Mountains
Post-wildfire watersheds are receiving emergency cooling interventions due to canopy loss and sediment-induced warming.
Midwest & Great Lakes
Urban heat influences have led to “cool corridor” stream projects combining stormwater retrofits with engineered shade.
Climate Adaptation Through a Systems Lens
Cooling rivers isn’t just about fish—it’s a signal of broader ecological stress. Overheating freshwater systems indicate:
declining watershed resilience
degraded riparian ecosystems
shifting hydrology under climate change
increased vulnerability for entire food webs
In this sense, cooling rivers is part of a larger push toward watershed-level climate adaptation, involving:
land-use reform
forest and wetland restoration
sustainable water management
climate-smart agricultural practices
emissions reduction across all sectors
River cooling sits at the intersection of emergency response and long-term planning.
Local Impacts: Why This Matters for Communities
Healthy rivers support:
fisheries
recreation economies
cultural resources for tribes
drinking-water quality
biodiversity and natural flood buffering
If rivers become too warm for iconic species like salmon or trout, communities lose both ecological and cultural identity—and face reduced economic resilience.
Cooling efforts aim to prevent ecosystem collapse and preserve local livelihoods.
The Bigger Pattern: Water Systems Entering a Hotter Era
Warming rivers are part of a broader national trend: freshwater systems are becoming climate-vulnerable hotspots. The U.S. Geological Survey and NOAA project increasing heat stress for aquatic ecosystems through mid-century, even under moderate emissions reductions.
This means cooling interventions will likely expand nationwide—not as luxury experiments but as necessary climate infrastructure.
Forward-Looking Takeaway
Cooling rivers won’t stop climate change, but it can buy time, protect species, and help communities adapt as deeper systemic solutions—emissions cuts, water reform, watershed restoration—progress more slowly.
The future of freshwater resilience will depend on flexible, science-based interventions that protect ecosystems under rapidly changing conditions. Actively cooling rivers may become one of the defining conservation innovations of the coming decades.
Coastal Adaptation Strategies: Building Resilience for U.S. Shorelines
Rising seas, stronger storms, and accelerating erosion are reshaping coastlines across the United States. What once were “future risks” are now daily realities for coastal communities from the Gulf Coast to the Eastern Seaboard to Pacific states dealing with intensifying El Niño cycles.
This guide breaks down the most effective, science-driven coastal adaptation strategies—focusing not just on engineering solutions, but long-term systems thinking that supports resilient communities, ecosystems, and economies.
Table of Contents
1. Why Coastal Adaptation Matters Now
Nearly 40% of Americans live in coastal counties, making the U.S. coastline one of the highest-risk population zones for climate impacts.
Sea-level rise, saltwater intrusion, storm surge, land subsidence, and loss of natural buffers all converge into a complex systems challenge.
Adaptation isn’t about fighting nature—it’s about working with ecological processes to reduce risks, preserve livelihoods, and plan for long-term resilience.
2. What’s Driving Coastal Change?
Climate change amplifies multiple processes:
Sea-Level Rise
Thermal expansion + melting land ice increases baseline water levels, pushing high tides further inland.
Stronger, Slower-Moving Storms
Warmer seas intensify hurricanes and nor’easters, producing extreme rainfall and prolonged surge conditions.
Coastal Erosion
Waves and currents remove beaches, dunes, and marshes faster than they can naturally rebuild.
Saltwater Intrusion
Aquifers and soils become saltier, affecting drinking water, crops, and ecosystems.
Human Alterations
Development, dredging, and hardened shorelines reduce natural resilience.
These combined forces make multi-layered adaptation strategies essential.
3. Adaptation Strategy #1: Nature-Based Solutions
Nature-based solutions are emerging as some of the most cost-effective, scalable tools for resilience.
Living Shorelines
Plantings of marsh grasses
Oyster reefs
Coir logs and biodegradable structures
Nearshore vegetation
They reduce wave energy, stabilize sediment, and provide habitat.
Dune Restoration
Rebuilding and stabilizing dunes with native grasses helps buffer storm surge and wind impacts.
Wetland Protection & Expansion
Wetlands store floodwaters, slow waves, and absorb pollutants—but require space and sediment to survive.
Mangrove and Kelp Restoration (Gulf & Pacific)
These reduce wave energy and support fisheries while sequestering carbon.
Why it works: Nature-based systems adapt over time, unlike rigid infrastructure that degrades or fails catastrophically.
The most resilient communities blend nature, science, governance, and culture into a unified strategy.
This isn’t only about protecting property—it’s about shaping sustainable, thriving coastal futures.
9. Forward-Looking Takeaways
No single solution is sufficient; layered defenses are essential.
Nature-based strategies are increasingly cost-effective & Discover-friendly.
Communities that plan early are less vulnerable and more economically stable.
Long-term coastal adaptation must consider 2050–2100, not just near-term forecasts.
Resilience is not a one-time project. It’s an evolving partnership between people, ecosystems, and foresight-driven planning.
Sea-Level Risk May Be Far Higher Than Assumed
A major blind spot in coastal risk mapping
For years, sea-level rise has been framed mainly as a problem of future climate change. But a new study published in Nature suggests that a large part of the problem may begin much earlier: with how coastal risk is measured in the first place.
The paper, by Katharina Seeger and Philip S. J. Minderhoud, argues that most coastal hazard assessments are not properly aligning land elevation with actual local sea level. That may sound technical. In practice, it means many global and regional flood-risk studies may be starting from the wrong baseline.
Their conclusion is striking. In the vast majority of assessed studies, coastal sea level was effectively assumed to be lower than it really is relative to the land. When corrected, the amount of land and the number of people projected to fall below sea level rises sharply.
This matters far beyond academic mapping. Coastal exposure estimates help shape adaptation plans, public investment, infrastructure timelines, insurance logic, climate finance priorities, and international risk narratives. If the baseline is wrong, every downstream decision can be distorted.
Table of Contents
What the study found
The researchers reviewed 385 peer-reviewed studies published between 2009 and 2025 on sea-level rise, coastal flooding, exposure, vulnerability, and related coastal hazards.
Their core finding was not just that many studies contain uncertainty, but that the underlying methodology is often flawed in a systematic way.
They found that:
more than 99% of evaluated studies handled sea-level and land elevation data inadequately
around 90% effectively assumed coastal sea level using geoid models rather than measured local sea level
only 0.3% of studies fully documented and correctly aligned elevation and sea-level data
That methodological gap has large consequences. On average, the study found that measured coastal sea level is higher than the baseline assumed in many assessments. Globally, the difference averages about 0.24 to 0.27 meters depending on the geoid model used. In some regions, especially in the Global South, the mismatch exceeds 1 meter.
That is not a rounding error. In low-lying deltas and coastal plains, a few decimeters can radically change exposure maps.
The overlooked technical issue with huge real-world consequences
At the heart of the paper is a geospatial problem: coastal elevation is often measured relative to one vertical reference system, while sea level is represented using another. If the two are not properly converted and aligned, the resulting hazard map can misjudge how high the land actually sits above the sea.
Many studies rely on digital elevation models, or DEMs, which are essential for estimating which places are near or below sea level. But a DEM is only as useful as the reference system behind it.
The problem identified in the paper is that many coastal hazard assessments treat the geoid as though it were the same as actual local mean sea level. It is not.
A geoid is a gravity-based model of Earth’s shape. Actual sea surface height is also shaped by currents, winds, tides, salinity, temperature, and large-scale ocean circulation. The gap between these is known as mean dynamic topography.
In some coastal regions, especially where gravity data is sparse or ocean dynamics are strong, that gap can be substantial. So when assessments skip the conversion from geoid-based elevation to measured local sea level, they can understate exposure from the start.
Why this matters more in the Global South
One of the most important dimensions of the study is geographic inequality.
The mismatch between assumed and measured sea level is not evenly distributed. In data-rich regions of the Global North, such as eastern North America and parts of Europe, geoid models tend to approximate local sea level more closely. But in many parts of the Global South, especially Southeast Asia, Pacific island regions, parts of Africa, Latin America, and the wider Indo-Pacific, the mismatch is much larger.
That means the places already facing some of the highest coastal vulnerability may also be the places where hazard assessments are most likely to underestimate the problem.
This is not only a technical issue. It is also a knowledge infrastructure issue.
If global methods are developed and validated primarily in better-instrumented regions, then exported worldwide without enough correction, they can reproduce geographic bias. The study hints at this larger pattern: methodologies that appear reliable in the Global North may not transfer cleanly to data-sparse coastal regions elsewhere.
For a sustainability audience, that matters because climate risk is never only about physical exposure. It is also about who gets measured accurately, whose vulnerabilities are legible to institutions, and whose risks remain statistically softened.
The exposure numbers rise sharply when sea level is corrected
The study tested what happens when coastal elevation is properly aligned to measured mean sea level rather than assumed geoid-based baselines.
Using a hypothetical 1 meter of relative sea-level rise, the authors found that:
land area falling below sea level increases by about 31% to 37%
population falling below sea level increases by about 48% to 68%
estimated exposed population rises to roughly 77 million to 132 million people
Those are global estimates across multiple elevation and population datasets.
The regional results are even more revealing. In Southeast Asia, the increase in estimated exposure is especially dramatic, with area and population projections rising by as much as the mid-90% range in some analyses.
This is exactly the kind of systems-level correction that changes how adaptation timelines are understood. A coast believed to have more time may actually be closer to critical thresholds already.
Sea-level rise is only part of the story
The paper also reinforces a broader point that sustainability coverage often misses: coastal risk is not driven by global sea-level rise alone.
Relative sea-level rise is shaped by at least two moving parts:
the ocean surface getting higher
the land surface getting lower
That second component includes land subsidence, which can be caused by natural processes but is often worsened by groundwater extraction, sediment starvation, urbanization, and other human pressures.
This is especially important in major delta regions. Some of the world’s most densely populated and agriculturally productive coastal zones are also subsiding. So even if global mean sea-level rise were moderate, local relative sea-level rise could still be severe.
The study’s message is that if assessments already begin with an understated sea-level baseline, then adding subsidence on top of that creates even more risk of delay and under-preparation.
Why this study matters for climate adaptation
The real importance of this research is not that it adds another alarming sea-level statistic. It is that it challenges the reliability of the tools used to guide adaptation itself.
Governments, city planners, donors, development banks, insurers, and international agencies often depend on coastal hazard assessments to prioritize investments. Those assessments influence:
where seawalls are built
when settlements are protected, relocated, or redesigned
which ports and roads are treated as urgent
how climate losses are estimated
where adaptation finance is directed
If sea-level exposure has been systematically underestimated, then adaptation may be sequenced too slowly, funded too weakly, or targeted too narrowly.
This is especially consequential for places that already have limited institutional capacity and weaker access to high-resolution elevation data.
What this means for the IPCC and global climate policy
The paper goes further than critiquing individual studies. It also investigates how these flawed assessments have circulated into larger climate reporting systems.
The authors found that dozens of evaluated studies were cited in the latest IPCC assessment cycle. Some of those studies likely carried the same vertical reference problems identified in the review.
That does not invalidate the broader reality of sea-level risk. But it does suggest that some widely cited exposure estimates may be conservative because they are built on inconsistent geospatial foundations.
For climate policy, this has several implications.
First, adaptation needs may be more immediate than current narratives suggest. Second, loss-and-damage discussions may be relying on incomplete exposure baselines. Third, future major assessments may need stronger review standards for geospatial methodology, not just emissions pathways and climate model outputs.
In other words, better sea-level science is not enough if the elevation side of the equation is mishandled.
A hidden standards problem in environmental research
One of the paper’s strongest contributions is that it frames the issue as a community-wide standards problem.
The authors argue that geodetic transformations are often left to end users who may not specialize in vertical reference systems. That creates predictable room for omission, incomplete documentation, and accidental error.
This is a familiar sustainability problem in another form: the quality of decisions depends on invisible technical standards that most readers never see.
The study calls for:
better documentation of vertical datums in publications
clearer peer-review expectations
data-provider support through better pre-aligned products
more careful use of sea-level references and elevation models in hazard studies
That may sound procedural, but it is foundational. In climate risk work, methodology is policy.
What coastal planners and sustainability readers should take from this
This paper does not mean every coastline is suddenly doomed. It does mean many coastlines may be closer to serious thresholds than previously estimated.
A useful takeaway is not panic, but recalibration.
The practical lesson is that coastal adaptation should not rely too heavily on single exposure maps, outdated elevation assumptions, or simplified global models used without local validation. The most credible coastal planning will increasingly need to combine:
accurate local elevation data
current sea-level references
subsidence measurements
transparent vertical datum handling
repeated updates as coastlines and land surfaces change
For sustainability policy, this also reinforces a broader principle: resilience depends on measurement quality. When the baseline is wrong, resilience planning becomes fragile.
The bigger pattern: climate risk is often underestimated by system design
This study fits a larger pattern in environmental governance.
Many risks are underestimated not because scientists are ignoring them, but because institutions inherit default assumptions, uneven datasets, and methods that travel poorly across regions. The result is not dramatic error everywhere. It is systematic softness around the edges of risk, especially where data is sparse and vulnerability is already high.
In that sense, the paper is about more than sea level. It is about how technical conventions can quietly shape the world’s understanding of planetary risk.
That is why this research matters for sustainabilityawakening.com’s audience. It shows that the climate challenge is not only about more heat, more water, or more extremes. It is also about whether our measurement systems are calibrated to the real world people are living in.
Conclusion
The most important message from this Nature study is deceptively simple: many coastal hazard assessments may be comparing land to the wrong sea level.
That mistake, repeated across the literature, can make coastal exposure appear smaller than it really is. Once corrected, millions more people and far more land fall into at-risk categories under rising seas.
For planners, policymakers, and sustainability readers, the implication is clear. Coastal adaptation is not only a race against future sea-level rise. It is also a race to improve the accuracy of today’s risk maps.
If the world is underestimating where the shoreline risk line already lies, then some adaptation deadlines may be arriving sooner than expected.
FAQ
What is the main finding of the new Nature sea-level study?
The study finds that most coastal hazard assessments do not properly align land elevation with actual local sea level, which leads to widespread underestimation of coastal exposure.
Why are many coastal hazard assessments wrong?
Many studies assume geoid-based elevation baselines represent local mean sea level. But actual sea level differs from geoid models because of ocean dynamics and regional data limitations.
How much sea-level risk may be underestimated?
Globally, the study suggests that with 1 meter of relative sea-level rise, 31% to 37% more land and 48% to 68% more people may fall below sea level than many assessments estimate.
Which regions are most affected by this problem?
The largest discrepancies appear in parts of the Global South, especially Southeast Asia, Pacific regions, parts of Africa, Latin America, and other data-sparse coastal areas.
What is relative sea-level rise?
Relative sea-level rise reflects both rising ocean levels and sinking land. It is often more relevant for local coastal risk than global mean sea-level rise alone.
Why does this matter for climate adaptation?
Adaptation planning depends on accurate exposure estimates. If risk maps understate present or future sea-level threat, governments may act too late or invest too little.
Does this change the overall science on sea-level rise?
It does not overturn sea-level science. Instead, it suggests many impact assessments may be conservative because they start from an inaccurate local elevation-to-sea-level relationship.
Internal Linking Opportunities
What is relative sea-level rise and why it matters more than global averages
Why land subsidence is accelerating coastal climate risk
How climate adaptation planning fails when baseline data is wrong
Sea-level rise in major deltas: Mekong, Nile, Ganges-Brahmaputra, Mississippi
The low-elevation coastal zone and why population counts vary so much
Climate finance and the challenge of measuring coastal vulnerability
Featured Snippet Targets
What is the problem with many coastal hazard assessments? Many coastal hazard assessments compare land elevation to geoid-based sea-level assumptions instead of measured local mean sea level. This can underestimate how much land and how many people are at risk from sea-level rise and coastal flooding.
Why is local sea level different from geoid models? Local sea level differs from geoid models because sea surface height is influenced by currents, winds, tides, salinity, and temperature, not just Earth’s gravity and rotation.
How much could coastal exposure be underestimated? A new Nature study suggests that with 1 meter of relative sea-level rise, proper sea-level referencing could increase estimated exposed land by 31% to 37% and exposed population by 48% to 68%.
The Rising Threat of Highly Dangerous Heat: How Climate Change Puts Lives at Risk
Introduction
Extreme heat has always been a part of Earth’s climate system. But in recent decades, something has shifted. Heat waves are becoming more frequent, longer-lasting, and far more intense than those experienced by previous generations.
Climate scientists now warn that parts of the world are beginning to face “dangerous heat” conditions — temperatures so extreme that they threaten human survival, especially when combined with humidity.
As climate change accelerates, this rising threat is moving from a distant concern to a daily reality affecting millions of people.
Understanding how and why this is happening reveals one of the most direct ways climate change is reshaping human life.
Table of Contents
What Is “Highly Dangerous Heat”?
Not all heat waves are the same.
Scientists often describe dangerous heat using a measurement called wet-bulb temperature, which combines heat and humidity to show how well the human body can cool itself.
Under normal conditions, humans regulate body temperature by sweating. But when humidity is high, sweat evaporates more slowly.
At a wet-bulb temperature of 35°C (95°F), the human body can no longer effectively cool itself — even in the shade with unlimited water.
This threshold represents a potentially fatal limit for human survival if exposure lasts several hours.
While such conditions were once extremely rare, climate change is pushing parts of the world closer to this dangerous boundary.
Why Climate Change Is Intensifying Heat
The root driver is straightforward: the planet is warming.
Human activities — especially the burning of fossil fuels — release greenhouse gases that trap heat in the atmosphere.
As a result:
Global average temperatures are rising
Heat waves occur more frequently
Hot conditions persist longer
Nighttime temperatures remain elevated
These changes create heat events that are both more intense and harder for communities to recover from.
Climate models show that for every 1°C of global warming, the likelihood of extreme heat increases dramatically.
Regions already accustomed to high temperatures — including parts of South Asia, the Middle East, and the southern United States — are particularly vulnerable.
The Hidden Role of Humidity
Heat becomes far more dangerous when humidity rises alongside temperature.
Warm air can hold more moisture. As the climate warms, the atmosphere absorbs additional water vapor.
This leads to conditions where temperatures might not appear extreme on a standard thermometer but still become physiologically dangerous.
In coastal and tropical regions, this combination can produce heat that feels overwhelming even at moderate temperatures.
Scientists warn that humid heat waves may become one of the most lethal climate hazards of the century.
Who Is Most at Risk?
Extreme heat affects everyone, but certain groups face far greater risks.
Elderly populations
Older adults often have reduced ability to regulate body temperature.
Outdoor workers
Farmers, construction workers, and delivery drivers may face prolonged exposure.
Low-income communities
Limited access to cooling, poor housing insulation, and urban heat islands increase vulnerability.
Urban residents
Cities trap heat due to concrete, asphalt, and limited vegetation — a phenomenon known as the urban heat island effect.
During severe heat events, hospitals frequently see spikes in heatstroke, dehydration, cardiovascular stress, and respiratory complications.
Cities Are Becoming Heat Traps
Urban areas are particularly vulnerable.
Buildings, roads, and infrastructure absorb sunlight during the day and release heat at night. This keeps cities warmer than surrounding rural areas.
In some cities, nighttime temperatures can remain 5–8°C (9–14°F) hotter than nearby countryside.
When heat waves occur, this trapped warmth prevents people from recovering overnight.
Rapid urban growth across the world means more people are now living inside these artificial heat environments.
Dangerous Heat Is Spreading to New Regions
Historically, deadly heat conditions were concentrated in tropical regions.
But climate change is expanding these risks.
Recent years have seen record-breaking heat waves in:
North America
Europe
China
South Asia
The Middle East
Some locations have experienced temperatures far beyond historical records, demonstrating how quickly climate patterns are shifting.
Scientists now estimate that extreme heat events that once occurred once every 50 years may soon happen every decade or less.
Economic and Infrastructure Impacts
Extreme heat does more than threaten health — it also disrupts entire systems.
High temperatures can:
Reduce agricultural yields
Stress power grids
Damage transportation infrastructure
Slow economic productivity
Increase wildfire risks
Energy demand for air conditioning surges during heat waves, sometimes pushing electricity systems to their limits.
At the same time, extreme heat can reduce the efficiency of power plants and transmission lines.
Adaptation Is Becoming Essential
Communities around the world are beginning to adapt to rising heat risks.
Strategies include:
Expanding urban tree cover
Installing reflective “cool roofs”
Designing buildings for passive cooling
Creating public cooling centers
Improving early warning systems
Cities like Phoenix, Athens, and Singapore are experimenting with heat-resilience strategies designed for a warming future.
However, adaptation has limits.
Without reducing greenhouse gas emissions, heat risks could eventually exceed the capacity of many regions to adapt safely.
The Bigger Climate Pattern
Dangerous heat is not an isolated problem.
It is part of a broader climate shift that includes:
stronger storms
rising sea levels
more intense droughts
shifting ecosystems
Heat, however, stands out as one of the most immediate and widespread impacts of climate change.
Unlike many environmental threats, extreme heat directly affects the human body.
It can become deadly in hours.
Looking Ahead
Climate projections suggest that heat waves will continue to intensify throughout the 21st century.
But the degree of risk depends heavily on global emissions choices made today.
Limiting global warming could significantly reduce the frequency of the most dangerous heat conditions.
Without action, some scientists warn that parts of the world could face heat levels that challenge the limits of human habitability.
Understanding and addressing the rising threat of dangerous heat is therefore not just a climate issue — it is a question of public health, economic stability, and the future livability of our planet.
FAQs
What is dangerous heat?
Dangerous heat refers to temperatures and humidity levels high enough to overwhelm the body’s cooling system, increasing the risk of heatstroke and death.
What is wet-bulb temperature?
Wet-bulb temperature measures heat combined with humidity and indicates how effectively sweat can cool the human body.
Why is climate change increasing heat waves?
Greenhouse gases trap heat in the atmosphere, raising global temperatures and making extreme heat events more frequent and intense.
Which regions are most vulnerable to extreme heat?
South Asia, the Middle East, parts of Africa, and southern regions of the United States are particularly vulnerable due to existing hot climates and rising humidity.
Colorado River Crisis: Why Lakes Mead and Powell Keep Shrinking
The Colorado River is the lifeline of the American Southwest. It supplies water to nearly 40 million people, irrigates millions of acres of farmland, and powers major cities from Phoenix to Los Angeles.
Yet the river’s two largest reservoirs — Lake Mead and Lake Powell — have fallen to historically low levels.
This isn’t just a drought story. It’s a systems story — involving climate change, long-standing water agreements, agricultural demand, and 20th-century assumptions that no longer hold in the 21st century.
Let’s unpack what’s really happening.
Where Are Lake Mead and Lake Powell?
Lake Mead sits on the Nevada–Arizona border and is formed by the Hoover Dam.
Lake Powell straddles Utah and Arizona, created by Glen Canyon Dam.
Together, they store massive volumes of Colorado River water, acting as the West’s emergency savings account.
But that savings account has been steadily drained.
Why Are Water Levels So Low?
1. A 20+ Year Megadrought
Since 2000, the Colorado River Basin has experienced one of the driest periods in at least 1,200 years. Tree-ring research confirms this is not a typical drought — it’s a climate-amplified megadrought.
Snowpack in the Rocky Mountains — the river’s primary source — has declined in reliability. Warmer winters mean more precipitation falls as rain instead of snow, and snow melts earlier in spring, reducing steady summer runoff.
2. Climate Change Is Shrinking the River
Higher temperatures increase:
Evaporation from reservoirs
Soil moisture loss
Plant water use
Atmospheric demand for water
Even in years with decent snowfall, rising heat means less water actually reaches Lake Powell and Lake Mead.
Climate models suggest the Colorado River’s long-term average flow could decline 10–30% by mid-century if warming continues.
3. The River Was Overallocated from the Start
The Colorado River Compact divided the river’s water among Western states based on unusually wet early-1900s data.
It assumed more water than the river typically produces.
Today, seven U.S. states — Arizona, California, Nevada, Utah, Colorado, New Mexico, and Wyoming — plus Mexico depend on a river that consistently delivers less than promised.
The math simply doesn’t work anymore.
Why These Reservoirs Matter So Much
Lake Mead and Lake Powell are not just scenic lakes. They are strategic infrastructure.
Drinking Water
Las Vegas draws about 90% of its water from Lake Mead.
Phoenix and Tucson rely heavily on Colorado River deliveries.
Southern California receives a major portion of its supply from the river.
Agriculture
The Colorado River irrigates some of the most productive farmland in America — especially in Arizona and California’s Imperial Valley. Winter vegetables consumed across the U.S. depend on this water.
Hydropower
The Hoover Dam and Glen Canyon Dam generate renewable electricity for millions.
When water levels fall too low, hydropower generation declines — and in extreme scenarios, dams risk hitting “dead pool” levels where water can no longer flow through turbines.
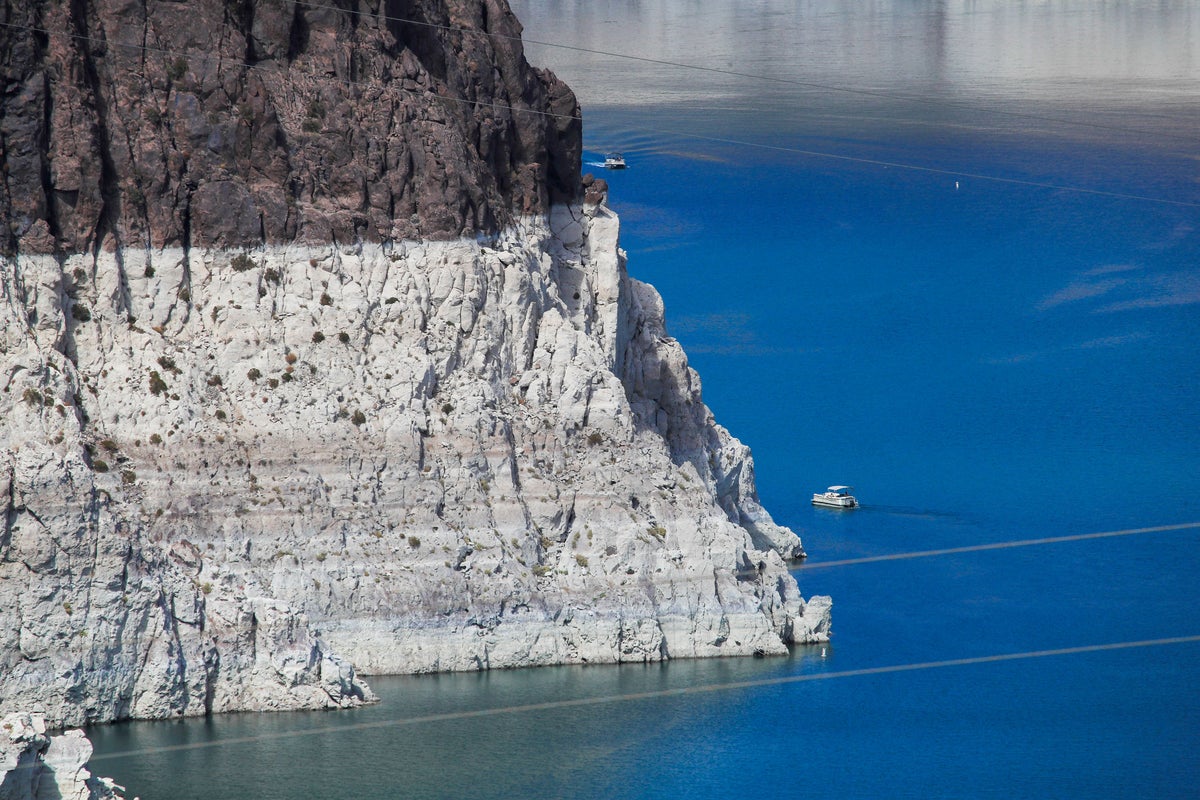
The “Bathtub Ring” Is a Warning Sign
The white mineral ring visible around both reservoirs marks previous high-water levels.
It’s more than a visual symbol — it represents lost storage capacity and the shrinking buffer against future drought years.
Federal Water Cuts and Emergency Agreements
In recent years, the U.S. government declared official shortages, triggering mandatory water cuts — especially for Arizona and Nevada.
The U.S. Bureau of Reclamation has pushed basin states toward temporary agreements to reduce withdrawals.
But these are short-term fixes.
The larger challenge is renegotiating post-2026 river management rules to reflect:
Lower average flows
Climate uncertainty
Competing state interests
Tribal water rights
Mexico’s allocation
This is not just hydrology — it’s geopolitics.
Is the Colorado River System Collapsing?
Not imminently.
Recent wet winters have temporarily boosted reservoir levels. But scientists warn against mistaking short-term recovery for long-term stability.
The structural problem remains:
Demand exceeds reliable supply.
Heat continues to rise.
Evaporation increases.
Without structural demand reductions, Lake Mead and Lake Powell will remain vulnerable.
Climate Change Lens: Why Heat Matters More Than Rain
One critical insight often missed in news coverage:
The Colorado River crisis is increasingly temperature-driven, not just precipitation-driven.
Even if rainfall stabilizes, higher temperatures reduce runoff efficiency.
This means:
The 20th-century water management model no longer fits a 21st-century climate.
The Southwest is entering a permanent “aridification” phase, not just episodic drought.
What Happens Next?
Several major transitions are underway:
1. Agricultural Water Efficiency
Expect more crop shifting, fallowing programs, and irrigation modernization.
2. Urban Conservation
Las Vegas has already removed ornamental lawns. Other cities are tightening efficiency standards.
3. Infrastructure Adaptation
States are investing in water recycling, desalination partnerships, and groundwater banking.
4. Post-2026 River Rules
New interstate agreements will define the future of the Colorado River system.
Bigger Pattern: The Future of Western Water
Lake Mead and Lake Powell are not isolated crises.
They represent:
Climate stress on legacy infrastructure
Overconfidence in historical hydrology
The limits of growth in arid regions
The beginning of climate-driven water governance reform
What happens here could become a model for other river basins worldwide.
FAQs
Why is Lake Mead drying up?
Lake Mead is shrinking due to prolonged drought, rising temperatures, and decades of over-allocation of Colorado River water.
Are Lake Mead and Lake Powell connected?
Yes. Water flows from Lake Powell downstream to Lake Mead via the Colorado River.
Could Lake Mead reach dead pool?
It is unlikely in the immediate future due to emergency management actions, but without long-term reforms, risks remain.
Is climate change the main cause?
Climate change is a major amplifying factor, especially through rising temperatures that reduce runoff efficiency.