Introduction
Climate change is one of the most pressing issues facing our planet today. The effects of global warming are already being felt around the world, from rising sea levels to more frequent and severe weather events. As scientists continue to study the causes and effects of climate change, new tools are being developed to help visualize the data and communicate the urgency of the situation. One such tool is the climate stripe.
What are Climate Stripes?
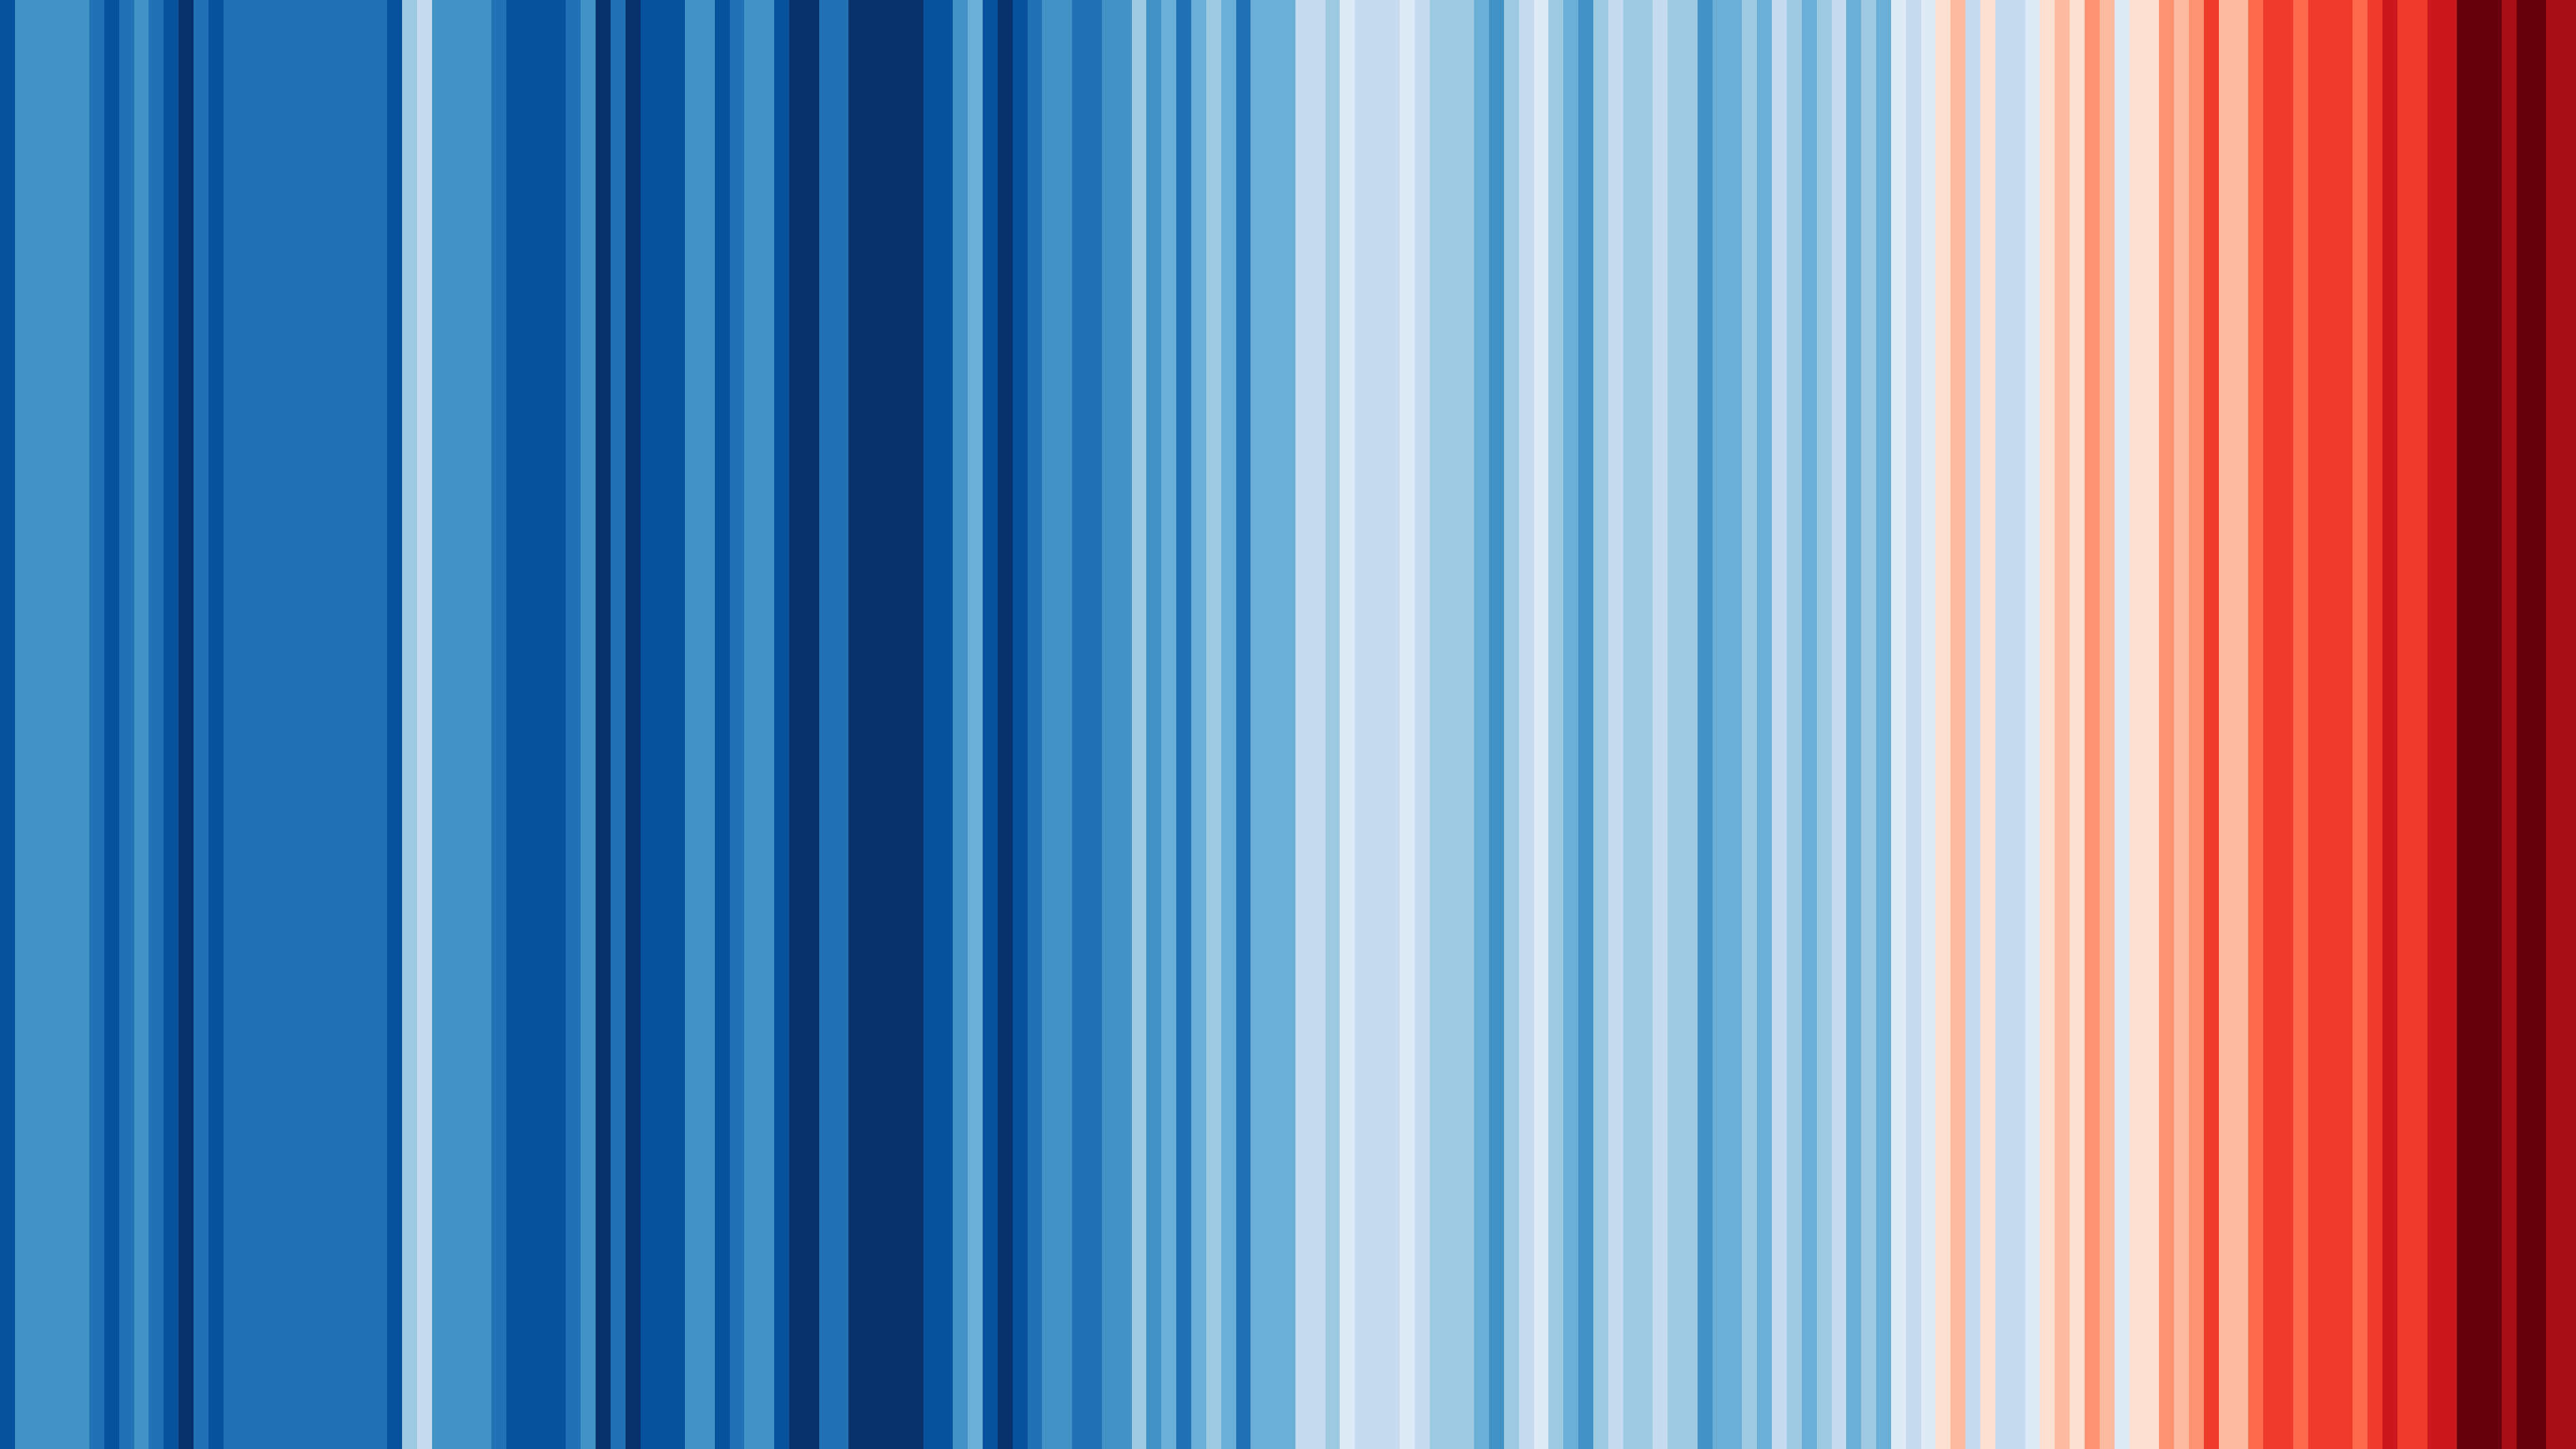
Climate stripes, also known as warming stripes, are a data visualization technique that uses a series of colored stripes to represent long-term temperature trends. Each stripe represents a single year, with blue stripes indicating cooler-than-average temperatures and red stripes indicating warmer-than-average temperatures. When viewed together, the stripes create a powerful visual representation of how global temperatures have changed over time.
The History of Climate Stripes
Climate stripes were first developed by Ed Hawkins, a climate scientist at the University of Reading in the UK. In 2018, Hawkins created a set of climate stripes for the UK that quickly went viral on social media. Since then, climate stripes have been created for countries around the world, as well as for the entire planet.
How are Climate Stripes Created?
Climate stripes are created using temperature data from the past 150 years. The data is processed to create a single value for each year, representing the average temperature for that year. The values are then converted into colors using a color scale, with blue representing cooler temperatures and red representing warmer temperatures. The resulting stripes are then arranged in chronological order to create a visual representation of temperature trends over time.
The Significance of Climate Stripes
Climate stripes are a powerful tool for communicating the urgency of the climate crisis. By visualizing the long-term trends in global temperatures, climate stripes make it clear that the planet is getting warmer at an alarming rate. They also help to dispel the myth that global warming is a natural cycle, showing that the current warming trend is far outside the range of natural variability.
How to Use Climate Stripes
Climate stripes can be used in a variety of ways to help raise awareness about the climate crisis. They can be shared on social media to help spread the word about the urgency of the situation. They can also be used in presentations and educational materials to help explain the science of climate change clearly and engagingly.
Conclusion
Climate stripes are a powerful tool for visualizing the long-term trends in global temperatures. By using a simple color scale to represent temperature data, climate stripes make it clear that the planet is getting warmer at an alarming rate. As we continue to grapple with the effects of climate change, it is important to use tools like climate stripes to help raise awareness about the urgency of the situation.
FAQs
- What is the history of climate stripes? Climate stripes were first developed by Ed Hawkins, a climate scientist at the University of Reading in the UK, in 2018.
- How are climate stripes created? Climate stripes are created using temperature data from the past 150 years. The data is processed to create a single value for each year, representing the average temperature for that year. The values are then converted into colors using a color scale, with blue representing cooler temperatures and red representing warmer temperatures.
- What is the significance of climate stripes? Climate stripes are a powerful tool for communicating the urgency of the climate crisis. By visualizing the long-term trends in global temperatures, climate stripes make it clear that the planet is getting warmer at an alarming rate.
- How can climate stripes be used? Climate stripes can be used in a variety of ways to help raise awareness about the climate crisis. They can be shared on social media to help spread the word about the urgency of the situation. They can also be used in presentations and educational materials to help explain the science of climate change clearly and engagingly.
- What is the future of climate stripes? As the effects of climate change continue to be felt around the world, climate stripes will likely become an increasingly important tool for communicating the urgency of the situation.


