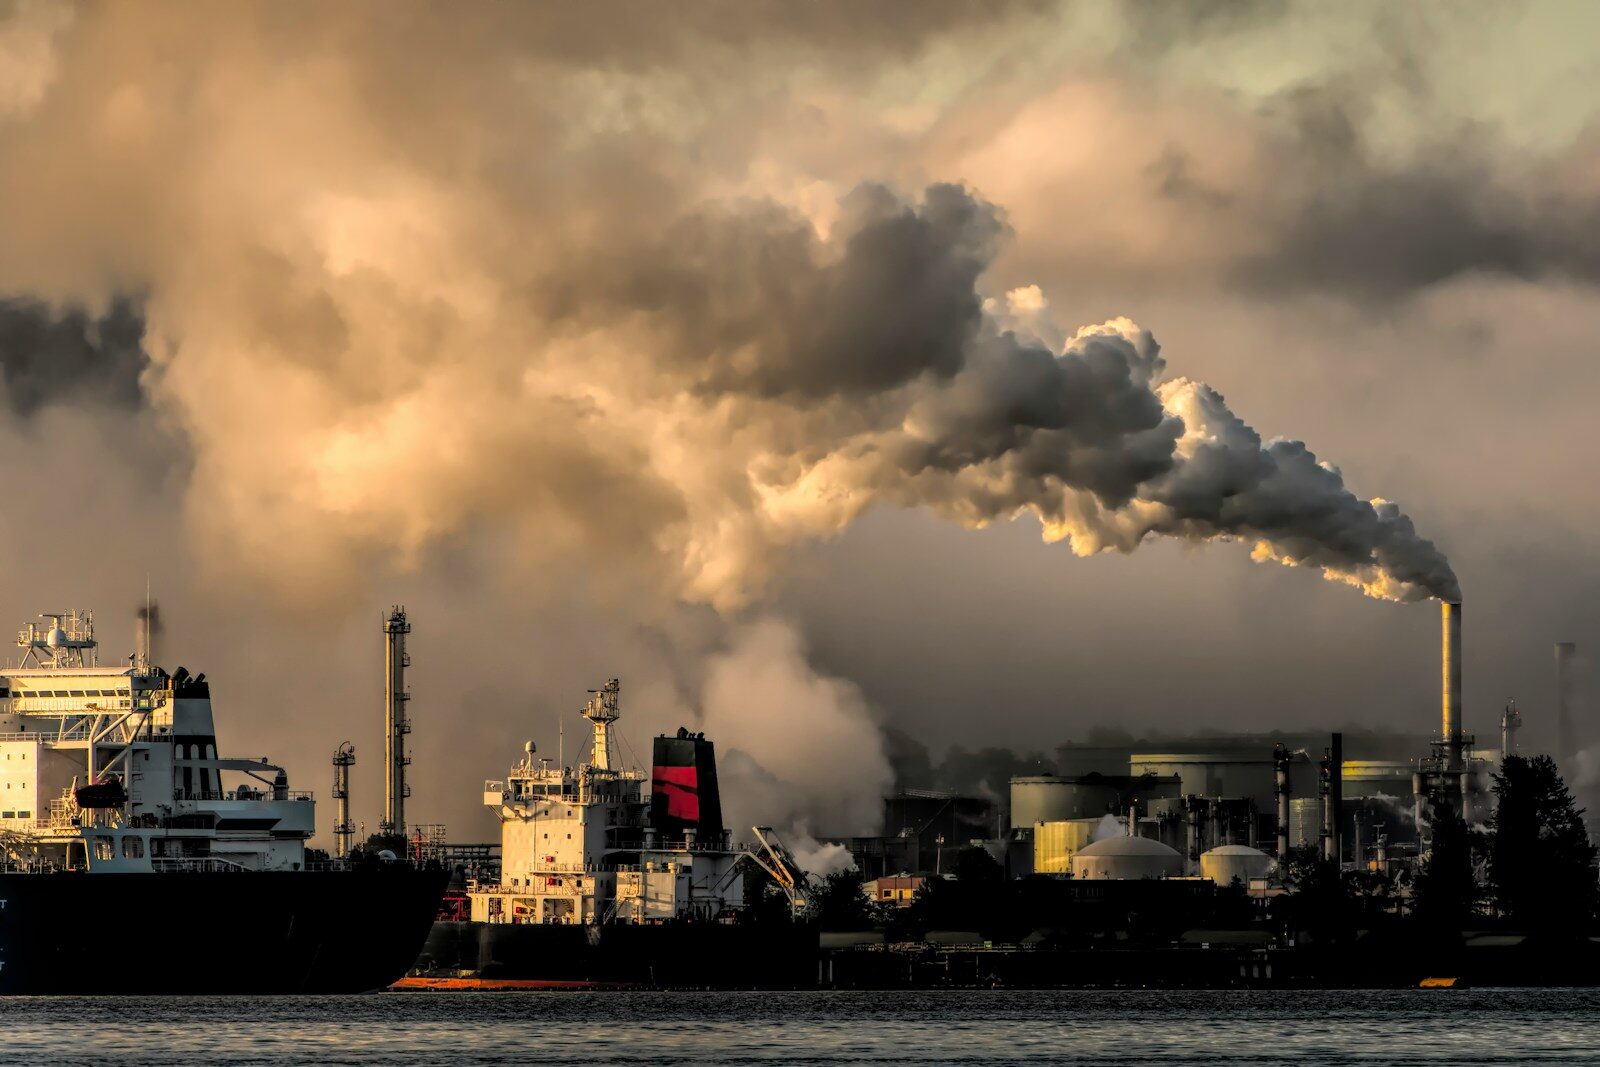
Introduction: Why Carbon Mapping Is Becoming Essential
Industrial sectors are under increasing pressure to measure, disclose, and reduce greenhouse gas emissions. But before reductions can happen, companies must understand where emissions originate.
That’s where industrial carbon mapping strategies come in — systematic approaches used to identify, quantify, and visualize emissions across operations, supply chains, and energy systems.
For U.S. industries especially, carbon mapping is no longer optional. It is becoming central to regulatory compliance, investor expectations, and long-term competitiveness.
Table of Contents
Scope 1, 2, and 3 Emissions: The Full Accounting Framework
Effective industrial carbon mapping begins with a clear understanding of the GHG Protocol’s three-scope framework, which organizes emissions by their relationship to the reporting company’s own operations. This framework, developed by the World Resources Institute and the World Business Council for Sustainable Development, has become the global standard for corporate greenhouse gas accounting and provides the conceptual foundation for all serious industrial emissions mapping efforts.
Scope 1 emissions are direct emissions from sources owned or controlled by the company — the combustion of fossil fuels in owned boilers, furnaces, kilns, and vehicle fleets; process emissions from chemical reactions in manufacturing; and fugitive emissions from refrigerants, methane leaks, and similar sources. These are typically the most straightforward to measure and the most directly within the company’s control to reduce. A steel mill’s Scope 1 emissions include the blast furnace coke combustion, the natural gas burned in reheating furnaces, and the methane that leaks from coal storage. A semiconductor fab’s Scope 1 emissions include the fluorinated gases used in wafer etching processes — some of the most potent greenhouse gases in existence, with global warming potentials thousands of times greater than CO2.
Scope 2 emissions are indirect emissions from the generation of purchased electricity, steam, heat, or cooling. For energy-intensive industries — aluminum smelting, data centers, electric arc furnaces — Scope 2 can dominate the emissions footprint. These emissions are produced by the utility generating the energy, not by the company consuming it, but the consuming company’s purchasing decisions directly determine whether those generation emissions occur. Scope 2 accounting can be done on a “location-based” basis — using average grid emission factors for the region — or a “market-based” basis — using emission factors from specific generators, renewable energy certificates, or power purchase agreements. The distinction matters significantly for companies that have signed renewable energy contracts or purchased RECs, as market-based accounting can show dramatically lower Scope 2 emissions than location-based accounting for the same physical energy consumption.
Scope 3 emissions are all other indirect emissions in a company’s value chain — upstream and downstream. For most companies, Scope 3 dominates the total footprint. A car manufacturer’s Scope 3 emissions include the steel, aluminum, and battery materials used in vehicle production (upstream), the emissions from vehicles during customer use (downstream), and the end-of-life processing of scrapped vehicles. A food company’s Scope 3 includes agricultural production of raw ingredients — often accounting for 70–80% of total emissions — and the emissions from consumer cooking and disposal. Scope 3 mapping is far more complex than Scope 1 and 2, requiring engagement with suppliers and customers and reliance on industry-average emission factors where direct measurement is impractical.
Advanced Measurement Technologies Transforming Industrial Carbon Mapping
The precision and completeness of industrial carbon mapping has improved dramatically in recent years as new measurement technologies have matured, regulatory disclosure requirements have incentivized investment in measurement infrastructure, and carbon markets have created financial value for accurate emissions data.
Continuous emissions monitoring systems (CEMS) are the gold standard for direct Scope 1 measurement at point sources. These systems, required by EPA regulations for major stationary sources like power plants and refineries, use spectrometric or electrochemical sensors to measure actual emissions concentrations in exhaust stacks in real time. CEMS provide far more accurate emissions data than activity-based calculations — multiplying fuel consumption by emission factors — because they capture the actual performance of combustion processes, which varies with fuel quality, equipment condition, and operating parameters. Modern CEMS can monitor CO2, SO2, NOx, and other pollutants simultaneously, providing comprehensive point-source emissions data.
Satellite-based emissions monitoring is enabling independent verification of industrial emissions at scale. The Sentinel-5P satellite operated by ESA, the TROPOMI instrument, and newer commercial satellites from GHGSat and Kayrros can detect methane plumes, NOx emissions, and CO2 concentrations at industrial facilities with increasing precision. These observations provide a check on reported emissions data that is independent of the facility’s own monitoring and reporting systems — a capability increasingly valued by regulators, investors, and climate scientists. A facility that reports low methane emissions but shows high methane concentrations in satellite observations has a credibility problem that is now quantifiable and potentially legally consequential.
IoT sensor networks enable granular real-time monitoring across complex industrial sites. Modern refineries, chemical plants, and manufacturing facilities can deploy thousands of low-cost wireless sensors that continuously monitor energy consumption, process parameters, and emissions proxies at individual equipment level. This granularity enables rapid identification of underperforming equipment, process optimization that reduces emissions, and fast detection of fugitive emissions events. Combined with digital twin technology — computational models that mirror the behavior of physical equipment — IoT data enables predictive maintenance approaches that prevent the equipment failures and process upsets that often cause emissions spikes.
Carbon Reduction Strategies: From Efficiency to Deep Decarbonization
Industrial carbon mapping serves its ultimate purpose when it translates into effective emissions reduction — a progression from identifying the largest opportunities to implementing technically and economically feasible solutions. The landscape of available strategies spans a wide range of cost, maturity, and scale.
Energy efficiency remains the first and most economically attractive lever for most industrial facilities. Process heat recovery — capturing waste heat from high-temperature processes and using it to preheat inputs or generate steam — typically delivers returns of 15–30% on investment and reduces fuel consumption proportionally. Variable speed drives on motors and pumps, which consume the majority of industrial electricity in many facility types, reduce power consumption by 20–50% when loads vary. Advanced process control systems that optimize operating parameters in real time against energy and emissions objectives consistently deliver efficiency improvements of 3–10% in complex manufacturing processes without capital investment beyond the control system itself.
Fuel switching — replacing fossil fuels with lower-carbon alternatives — delivers substantial emissions reductions in process heat applications where electrification is technically challenging. Green hydrogen, produced by electrolysis powered by renewable electricity, can replace natural gas in industrial burners and as a chemical feedstock with near-zero direct emissions. Biomethane — methane captured from biological decomposition of organic waste — is chemically identical to natural gas but has a substantially lower lifecycle carbon footprint. Bioenergy with carbon capture and storage (BECCS) — burning biomass for energy while capturing and storing the CO2 — can in principle generate negative emissions, though scaling and sustainability constraints limit its applicability.
Carbon capture, utilization, and storage (CCUS) is particularly relevant for industrial processes that produce CO2 as an unavoidable chemical byproduct rather than simply from combustion. Cement production generates CO2 from the calcination of limestone — a reaction that would produce CO2 even with a non-fossil heat source. Steel production via traditional blast furnace routes generates CO2 from the reduction of iron ore by coke. For these “process emissions,” carbon capture at the source followed by geological storage is currently the only available technology pathway to deep decarbonization, as no alternative chemistry exists that avoids CO2 production entirely. The cost of carbon capture in industrial applications ranges from $50–120 per ton of CO2 for high-concentration sources like ethanol production to $100–300 per ton for dilute industrial gas streams like cement kilns.
What Is Industrial Carbon Mapping?
Industrial carbon mapping is the process of:
- Measuring greenhouse gas emissions across operations
- Identifying emission sources (direct and indirect)
- Visualizing emissions across facilities, processes, and supply chains
- Creating a baseline for reduction strategies
It typically covers:
- Scope 1: Direct emissions (fuel combustion, on-site processes)
- Scope 2: Indirect emissions (purchased electricity, heat)
- Scope 3: Supply chain and downstream emissions
Why Carbon Mapping Matters for Industry
1. Regulatory Pressure Is Increasing
In the U.S., emissions disclosure rules are tightening at both federal and state levels. Companies that fail to track emissions risk compliance issues and financial penalties.
2. Investors Demand Transparency
ESG-focused investors increasingly require detailed emissions data. Carbon mapping provides the foundation for credible reporting.
3. Cost Reduction Opportunities
Mapping often reveals inefficiencies:
- Energy waste
- Process leaks
- Logistics inefficiencies
Reducing emissions frequently reduces operating costs.
4. Competitive Advantage
Companies with clear carbon strategies are better positioned for:
- Low-carbon supply contracts
- Government incentives
- Future carbon pricing systems
Core Industrial Carbon Mapping Strategies
1. Facility-Level Emissions Mapping
This is the starting point for most industries.
What it includes:
- Energy consumption by equipment
- Fuel usage tracking
- Process emissions (e.g., cement, steel, chemicals)
Tools used:
- Smart meters
- IoT sensors
- Energy management systems
Outcome: A detailed emissions profile for each plant or site.
2. Process-Based Carbon Mapping
Instead of focusing only on facilities, this approach tracks emissions by production processes.
Example:
- Heat-intensive processes
- Chemical reactions
- Manufacturing lines
Why it matters:
It identifies high-emission steps within production, enabling targeted efficiency improvements.
3. Supply Chain (Scope 3) Mapping
This is often the most complex — and impactful — strategy.
Includes:
- Raw material sourcing
- Transportation
- Supplier emissions
- Product lifecycle impacts
Approaches:
- Supplier surveys
- Emission factor databases
- Lifecycle assessment (LCA) models
Insight: For many industries, over 70% of emissions come from Scope 3.
4. Digital Twin and Simulation Modeling
Advanced industries are now using digital twins — virtual models of physical systems.
Capabilities:
- Simulate emissions under different scenarios
- Test decarbonization strategies before implementation
- Optimize energy use in real time
Benefit: Reduces risk and improves decision-making accuracy.
5. Geospatial Carbon Mapping
This strategy visualizes emissions geographically across:
- Facilities
- Logistics routes
- Supply chain nodes
Tools:
- GIS platforms
- Satellite data
- Remote sensing technologies
Use case:
Identifying regional emission hotspots and infrastructure dependencies.
Key Technologies Enabling Carbon Mapping
Data Collection Systems
- IoT sensors
- Smart grids
- Automated reporting tools
Analytics Platforms
- Carbon accounting software
- AI-driven emissions analysis
- Predictive modeling tools
Reporting Frameworks
- Greenhouse Gas Protocol
- CDP (Carbon Disclosure Project)
- SEC climate disclosure frameworks (emerging)
Challenges in Industrial Carbon Mapping
1. Data Gaps
Incomplete or inconsistent data — especially in supply chains — can limit accuracy.
2. Standardization Issues
Different methodologies can produce varying results, complicating comparisons.
3. High Initial Costs
Implementing monitoring systems and software can require upfront investment.
4. Scope 3 Complexity
Tracking emissions across global suppliers remains one of the biggest barriers.
Best Practices for Effective Carbon Mapping
Start With High-Impact Areas
Focus first on energy-intensive operations and major emission sources.
Use Standard Frameworks
Align with globally recognized standards to ensure credibility.
Automate Data Collection
Reduce manual reporting errors through digital systems.
Engage Suppliers Early
Collaboration is essential for accurate Scope 3 mapping.
Continuously Update Models
Carbon mapping is not a one-time exercise — it requires ongoing refinement.
The Bigger Picture: Carbon Mapping as a Systems Tool
Industrial carbon mapping is not just about compliance — it is a systems-level diagnostic tool.
It reveals:
- How energy flows through industrial systems
- Where inefficiencies accumulate
- How supply chains amplify emissions
In this sense, carbon mapping becomes the foundation for industrial transformation, not just emissions reporting.
Future Trends in Carbon Mapping
Real-Time Emissions Tracking
Continuous monitoring instead of annual reporting.
AI-Driven Optimization
Machine learning identifying reduction opportunities automatically.
Integration With Financial Systems
Linking emissions directly to cost and investment decisions.
Policy Alignment
Carbon maps increasingly used to meet national and international climate targets.
Conclusion
Industrial carbon mapping strategies are rapidly evolving from optional sustainability tools into core operational systems.
For U.S. industries, the question is no longer whether to map emissions — but how deeply and accurately it can be done.
Companies that invest early in robust carbon mapping will not only reduce emissions but also gain efficiency, resilience, and long-term strategic advantage.
FAQs
What is the first step in industrial carbon mapping?
The first step is establishing a baseline by measuring Scope 1 and Scope 2 emissions at the facility level.
Why is Scope 3 important?
Scope 3 often represents the majority of emissions, especially in manufacturing and retail supply chains.
Are carbon mapping tools expensive?
Costs vary, but digital tools are becoming more affordable, especially compared to long-term efficiency gains.
How often should carbon mapping be updated?
Ideally, continuously or at least annually, with real-time tracking becoming more common.
Authoritative Source: NOAA Climate Data
🎬 Watch our Web Story: Industrial Carbon Mapping: How US Industries Track & Cut Emissions
📖 Related: Climate Change and Its Growing Impact on Agriculture
Watch the Web Story: US Methane Regulations 2026 — a quick visual guide to how 2026 policy developments are reshaping America’s environmental landscape.
EU CBAM Duty & Tariff Calculator
Model European Carbon Border Adjustment Mechanism liability, embedded specific emissions, and weekly EU ETS certificate pricing for regulated goods.
Model CBAM Duty →